|
Download Data (XLS File) |
|
|||||
|
|||||
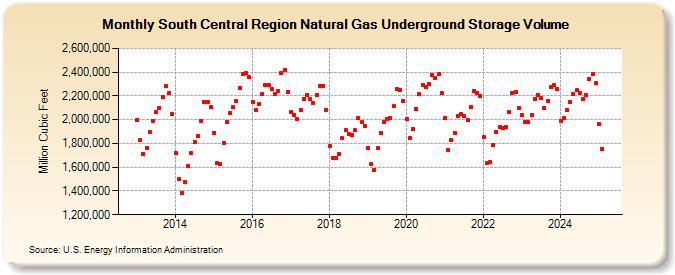
| South Central Region Natural Gas Underground Storage Volume (Million Cubic Feet) | |||||
| Year | Jan | Feb | Mar | Apr | May | Jun | Jul | Aug | Sep | Oct | Nov | Dec |
|---|---|---|---|---|---|---|---|---|---|---|---|---|
| 2013 | 2,000,884 | 1,827,846 | 1,714,360 | 1,762,847 | 1,899,091 | 1,989,604 | 2,061,520 | 2,097,649 | 2,191,153 | 2,281,316 | 2,224,775 | 2,044,114 |
| 2014 | 1,719,230 | 1,501,862 | 1,386,639 | 1,476,237 | 1,609,924 | 1,719,264 | 1,809,652 | 1,864,897 | 1,989,374 | 2,150,785 | 2,144,710 | 2,104,699 |
| 2015 | 1,889,028 | 1,633,827 | 1,629,734 | 1,804,453 | 1,976,964 | 2,060,188 | 2,109,107 | 2,154,799 | 2,265,050 | 2,381,950 | 2,393,586 | 2,359,597 |
| 2016 | 2,152,101 | 2,077,659 | 2,133,050 | 2,216,526 | 2,295,098 | 2,294,907 | 2,261,302 | 2,217,756 | 2,243,444 | 2,392,995 | 2,420,944 | 2,231,009 |
| 2017 | 2,065,185 | 2,040,541 | 2,007,443 | 2,085,488 | 2,173,372 | 2,208,799 | 2,173,484 | 2,139,913 | 2,208,543 | 2,283,448 | 2,287,200 | 2,084,282 |
| 2018 | 1,774,439 | 1,681,156 | 1,676,221 | 1,712,706 | 1,841,679 | 1,909,271 | 1,877,696 | 1,867,055 | 1,910,498 | 2,011,953 | 1,977,243 | 1,942,936 |
| 2019 | 1,759,576 | 1,624,419 | 1,578,624 | 1,759,822 | 1,891,713 | 1,983,933 | 2,008,208 | 2,015,827 | 2,115,929 | 2,258,565 | 2,247,143 | 2,161,015 |
| 2020 | 2,001,696 | 1,844,954 | 1,925,259 | 2,093,993 | 2,212,538 | 2,293,489 | 2,279,197 | 2,303,203 | 2,379,779 | 2,350,135 | 2,381,804 | 2,224,245 |
| 2021 | 2,013,916 | 1,744,367 | 1,825,110 | 1,887,998 | 2,034,568 | 2,049,073 | 2,028,742 | 1,995,869 | 2,110,147 | 2,242,597 | 2,227,061 | 2,199,203 |
| 2022 | 1,850,517 | 1,636,035 | 1,643,629 | 1,787,453 | 1,896,413 | 1,939,726 | 1,928,471 | 1,941,546 | 2,061,920 | 2,225,634 | 2,233,941 | 2,100,912 |
| 2023 | 2,040,309 | 1,980,106 | 1,979,124 | 2,043,450 | 2,157,511 | 2,207,174 | 2,178,365 | 2,102,074 | 2,161,758 | 2,281,258 | 2,288,998 | 2,256,066 |
| 2024 | 1,984,830 | 2,016,124 | 2,080,675 | 2,150,999 | 2,216,950 | 2,245,349 | 2,228,036 | 2,173,577 | 2,207,318 | 2,345,849 | 2,380,357 | 2,304,128 |
| 2025 | 1,956,615 | 1,753,684 | 1,869,592 | 1,993,886 | 2,142,675 | 2,230,461 | 2,229,677 | 2,223,343 | 2,275,418 | 2,381,313 | 2,424,539 | 2,274,479 |
| 2026 | 1,946,964 | 1,807,410 | 1,885,650 | 1,989,616 | ||||||||
| - = No Data Reported; -- = Not Applicable; NA = Not Available; W = Withheld to avoid disclosure of individual company data. |
| Release Date: 6/30/2026 |
| Next Release Date: 7/31/2026 |