|
Download Data (XLS File) |
|
|||||
|
|||||
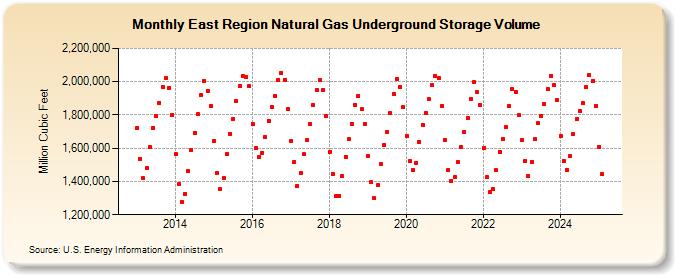
| East Region Natural Gas Underground Storage Volume (Million Cubic Feet) | |||||
| Year | Jan | Feb | Mar | Apr | May | Jun | Jul | Aug | Sep | Oct | Nov | Dec |
|---|---|---|---|---|---|---|---|---|---|---|---|---|
| 2013 | 1,722,658 | 1,537,168 | 1,420,451 | 1,479,382 | 1,605,393 | 1,723,109 | 1,791,221 | 1,873,432 | 1,967,647 | 2,023,429 | 1,964,647 | 1,802,131 |
| 2014 | 1,564,431 | 1,384,611 | 1,278,438 | 1,325,067 | 1,461,469 | 1,587,627 | 1,694,199 | 1,802,786 | 1,919,116 | 2,005,935 | 1,944,986 | 1,855,842 |
| 2015 | 1,644,619 | 1,449,300 | 1,351,884 | 1,421,383 | 1,564,828 | 1,687,094 | 1,776,662 | 1,881,402 | 1,975,365 | 2,034,269 | 2,029,292 | 1,971,887 |
| 2016 | 1,746,119 | 1,599,174 | 1,547,713 | 1,573,967 | 1,667,827 | 1,765,941 | 1,846,645 | 1,916,368 | 2,010,290 | 2,051,375 | 2,010,621 | 1,835,379 |
| 2017 | 1,641,876 | 1,519,826 | 1,372,618 | 1,448,225 | 1,562,811 | 1,646,487 | 1,745,290 | 1,861,126 | 1,949,878 | 2,007,784 | 1,950,601 | 1,793,767 |
| 2018 | 1,575,896 | 1,445,554 | 1,310,533 | 1,312,232 | 1,431,246 | 1,548,310 | 1,652,759 | 1,747,153 | 1,861,818 | 1,913,976 | 1,833,606 | 1,742,933 |
| 2019 | 1,551,110 | 1,394,714 | 1,298,417 | 1,376,804 | 1,502,037 | 1,621,086 | 1,694,920 | 1,808,969 | 1,928,741 | 2,016,500 | 1,970,232 | 1,848,219 |
| 2020 | 1,675,898 | 1,521,093 | 1,468,100 | 1,511,981 | 1,639,520 | 1,742,205 | 1,809,251 | 1,893,069 | 1,981,094 | 2,035,420 | 2,021,547 | 1,855,292 |
| 2021 | 1,649,355 | 1,468,812 | 1,403,783 | 1,425,507 | 1,517,737 | 1,607,483 | 1,697,641 | 1,781,306 | 1,897,660 | 1,997,718 | 1,936,138 | 1,859,980 |
| 2022 | 1,598,189 | 1,426,452 | 1,336,295 | 1,353,755 | 1,466,778 | 1,578,020 | 1,653,409 | 1,725,757 | 1,856,159 | 1,954,856 | 1,939,619 | 1,798,758 |
| 2023 | 1,647,941 | 1,523,238 | 1,434,151 | 1,519,034 | 1,652,897 | 1,748,757 | 1,794,702 | 1,867,695 | 1,955,337 | 2,034,355 | 1,978,230 | 1,889,065 |
| 2024 | 1,673,696 | 1,524,330 | 1,471,028 | 1,550,989 | 1,682,419 | 1,774,803 | 1,825,538 | 1,869,677 | 1,967,682 | 2,037,751 | 2,006,001 | 1,852,683 |
| 2025 | 1,609,189 | 1,443,831 | 1,400,051 | 1,464,443 | 1,614,645 | 1,717,726 | 1,761,681 | 1,853,453 | 1,958,906 | 2,018,464 | 1,982,274 | 1,812,763 |
| 2026 | 1,588,052 | 1,425,551 | 1,381,220 | 1,468,858 | ||||||||
| - = No Data Reported; -- = Not Applicable; NA = Not Available; W = Withheld to avoid disclosure of individual company data. |
| Release Date: 6/30/2026 |
| Next Release Date: 7/31/2026 |