|
Download Data (XLS File) |
|
|||||
|
|||||
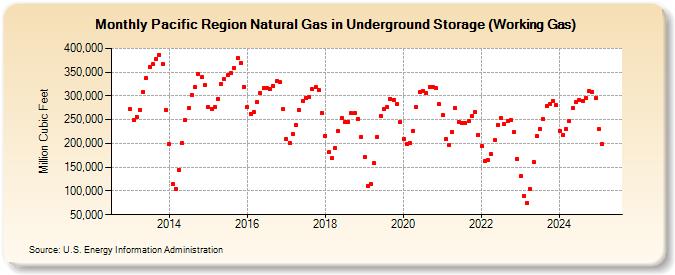
| Pacific Region Natural Gas in Underground Storage (Working Gas) (Million Cubic Feet) | |||||
| Year | Jan | Feb | Mar | Apr | May | Jun | Jul | Aug | Sep | Oct | Nov | Dec |
|---|---|---|---|---|---|---|---|---|---|---|---|---|
| 2013 | 271,697 | 249,463 | 256,311 | 271,182 | 309,129 | 338,029 | 360,571 | 366,258 | 377,970 | 386,643 | 367,679 | 270,774 |
| 2014 | 197,953 | 115,235 | 104,941 | 144,268 | 200,453 | 249,196 | 274,725 | 302,752 | 318,020 | 345,640 | 339,201 | 322,520 |
| 2015 | 275,977 | 273,151 | 275,677 | 293,557 | 325,456 | 335,995 | 344,215 | 347,827 | 358,941 | 379,501 | 368,875 | 319,740 |
| 2016 | 276,196 | 262,566 | 265,792 | 286,993 | 305,681 | 315,789 | 316,164 | 314,524 | 321,438 | 331,219 | 328,428 | 271,436 |
| 2017 | 209,807 | 200,877 | 218,946 | 238,015 | 270,239 | 288,377 | 295,416 | 297,196 | 313,898 | 317,750 | 311,499 | 264,432 |
| 2018 | 216,356 | 181,286 | 168,873 | 190,017 | 226,291 | 253,246 | 244,188 | 246,067 | 263,003 | 264,084 | 252,029 | 214,174 |
| 2019 | 170,928 | 110,759 | 114,514 | 158,439 | 214,374 | 258,716 | 271,651 | 276,319 | 294,116 | 292,341 | 282,582 | 244,914 |
| 2020 | 209,901 | 199,067 | 200,448 | 227,103 | 276,321 | 307,639 | 310,853 | 306,636 | 318,456 | 319,786 | 315,940 | 282,243 |
| 2021 | 259,441 | 209,174 | 196,500 | 224,021 | 274,256 | 245,655 | 243,902 | 242,070 | 247,595 | 257,265 | 266,364 | 218,285 |
| 2022 | 193,770 | 163,192 | 164,849 | 177,395 | 207,280 | 239,541 | 252,923 | 240,180 | 247,427 | 249,994 | 224,244 | 166,826 |
| 2023 | 130,893 | 90,225 | 74,186 | 105,013 | 161,299 | 215,557 | 231,353 | 251,393 | 278,303 | 282,408 | 289,655 | 280,098 |
| 2024 | 226,759 | 218,742 | 230,590 | 246,357 | 274,146 | 286,441 | 291,492 | 290,099 | 295,747 | 309,960 | 308,928 | 294,871 |
| 2025 | 230,155 | 199,311 | 205,184 | 230,551 | 261,250 | 288,778 | 305,185 | 295,722 | 303,034 | 317,404 | 313,394 | 303,992 |
| 2026 | 272,025 | 257,837 | 259,494 | 274,646 | ||||||||
| - = No Data Reported; -- = Not Applicable; NA = Not Available; W = Withheld to avoid disclosure of individual company data. |
| Release Date: 6/30/2026 |
| Next Release Date: 7/31/2026 |