|
Download Data (XLS File) |
|
|||||
|
|||||
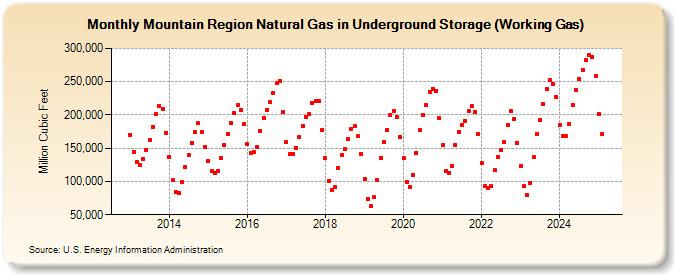
| Mountain Region Natural Gas in Underground Storage (Working Gas) (Million Cubic Feet) | |||||
| Year | Jan | Feb | Mar | Apr | May | Jun | Jul | Aug | Sep | Oct | Nov | Dec |
|---|---|---|---|---|---|---|---|---|---|---|---|---|
| 2013 | 170,239 | 144,706 | 129,036 | 124,639 | 134,489 | 147,902 | 162,115 | 182,104 | 201,048 | 214,044 | 209,600 | 173,398 |
| 2014 | 137,378 | 102,507 | 83,983 | 82,058 | 98,717 | 121,623 | 140,461 | 157,716 | 174,610 | 187,375 | 174,783 | 151,841 |
| 2015 | 130,966 | 115,882 | 113,341 | 116,132 | 135,193 | 154,611 | 171,815 | 187,116 | 203,226 | 214,692 | 207,323 | 185,729 |
| 2016 | 155,618 | 143,129 | 144,056 | 151,738 | 176,251 | 196,013 | 207,988 | 218,798 | 232,217 | 248,109 | 251,253 | 204,436 |
| 2017 | 159,200 | 140,525 | 141,654 | 151,003 | 166,701 | 183,841 | 197,392 | 201,682 | 218,381 | 220,620 | 220,640 | 176,931 |
| 2018 | 135,051 | 100,727 | 86,992 | 91,148 | 119,907 | 139,990 | 148,052 | 163,475 | 179,384 | 183,091 | 167,887 | 141,460 |
| 2019 | 103,471 | 73,132 | 63,339 | 76,438 | 101,820 | 135,140 | 158,783 | 177,921 | 200,486 | 206,239 | 196,303 | 167,400 |
| 2020 | 134,997 | 99,387 | 91,873 | 109,496 | 143,384 | 177,055 | 200,209 | 214,782 | 235,094 | 239,428 | 236,362 | 195,131 |
| 2021 | 154,862 | 115,106 | 113,427 | 123,884 | 154,829 | 175,062 | 184,546 | 190,407 | 205,222 | 213,318 | 204,403 | 171,282 |
| 2022 | 127,863 | 92,823 | 90,371 | 92,991 | 116,554 | 137,013 | 147,446 | 159,456 | 184,277 | 206,033 | 194,335 | 157,533 |
| 2023 | 122,780 | 93,683 | 79,253 | 98,121 | 136,361 | 171,486 | 192,156 | 216,449 | 239,483 | 251,867 | 246,535 | 227,577 |
| 2024 | 185,016 | 168,740 | 167,813 | 187,052 | 215,500 | 237,971 | 253,456 | 268,159 | 282,166 | 289,854 | 287,393 | 258,790 |
| 2025 | 201,197 | 170,943 | 169,769 | 180,923 | 208,927 | 231,923 | 249,658 | 247,829 | 266,062 | 279,028 | 276,214 | 249,723 |
| 2026 | 204,196 | 189,861 | 197,792 | 203,559 | ||||||||
| - = No Data Reported; -- = Not Applicable; NA = Not Available; W = Withheld to avoid disclosure of individual company data. |
| Release Date: 6/30/2026 |
| Next Release Date: 7/31/2026 |