|
Download Data (XLS File) |
|
|||||
|
|||||
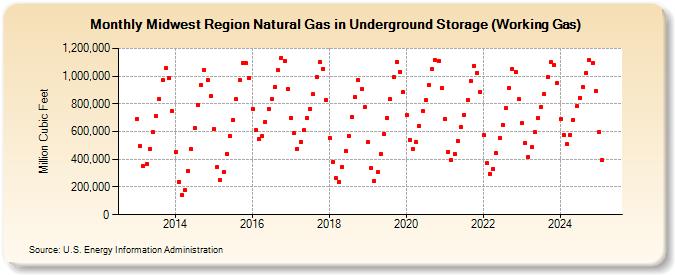
| Midwest Region Natural Gas in Underground Storage (Working Gas) (Million Cubic Feet) | |||||
| Year | Jan | Feb | Mar | Apr | May | Jun | Jul | Aug | Sep | Oct | Nov | Dec |
|---|---|---|---|---|---|---|---|---|---|---|---|---|
| 2013 | 692,747 | 493,870 | 352,454 | 369,030 | 474,815 | 596,140 | 708,799 | 836,317 | 969,576 | 1,055,661 | 984,792 | 746,441 |
| 2014 | 449,673 | 237,999 | 142,513 | 179,338 | 317,901 | 471,765 | 625,764 | 788,930 | 935,822 | 1,047,609 | 972,803 | 854,545 |
| 2015 | 618,383 | 345,662 | 252,518 | 309,719 | 438,863 | 565,724 | 684,546 | 831,992 | 973,040 | 1,095,397 | 1,091,834 | 988,576 |
| 2016 | 764,675 | 608,139 | 543,495 | 566,513 | 671,284 | 763,161 | 834,064 | 920,528 | 1,041,781 | 1,133,663 | 1,112,086 | 905,711 |
| 2017 | 698,425 | 588,734 | 476,939 | 524,350 | 608,794 | 700,955 | 763,673 | 868,205 | 992,738 | 1,100,590 | 1,053,879 | 828,771 |
| 2018 | 553,640 | 380,867 | 261,480 | 234,889 | 343,391 | 458,621 | 571,332 | 704,789 | 846,187 | 971,391 | 907,567 | 777,113 |
| 2019 | 521,364 | 337,015 | 241,813 | 305,166 | 439,208 | 579,347 | 696,246 | 834,229 | 990,121 | 1,102,942 | 1,029,811 | 884,811 |
| 2020 | 717,082 | 541,075 | 471,336 | 523,288 | 640,524 | 746,986 | 827,116 | 934,701 | 1,052,642 | 1,113,200 | 1,107,643 | 917,516 |
| 2021 | 692,381 | 453,463 | 395,231 | 437,993 | 531,680 | 629,538 | 720,101 | 827,456 | 965,715 | 1,075,361 | 1,022,811 | 886,600 |
| 2022 | 574,953 | 372,287 | 296,106 | 330,208 | 444,258 | 557,011 | 648,323 | 767,014 | 916,587 | 1,053,441 | 1,030,375 | 831,311 |
| 2023 | 660,150 | 518,227 | 416,673 | 485,033 | 595,169 | 700,626 | 779,961 | 870,601 | 992,843 | 1,097,760 | 1,076,772 | 948,913 |
| 2024 | 689,483 | 572,150 | 507,346 | 578,562 | 685,504 | 781,085 | 844,382 | 920,688 | 1,022,034 | 1,115,779 | 1,096,601 | 893,353 |
| 2025 | 598,312 | 393,124 | 364,933 | 444,248 | 580,722 | 691,181 | 766,730 | 865,708 | 987,501 | 1,098,162 | 1,067,567 | 829,302 |
| 2026 | 558,379 | 389,158 | 350,737 | 443,631 | ||||||||
| - = No Data Reported; -- = Not Applicable; NA = Not Available; W = Withheld to avoid disclosure of individual company data. |
| Release Date: 6/30/2026 |
| Next Release Date: 7/31/2026 |