|
Download Data (XLS File) |
|
|||||
|
|||||
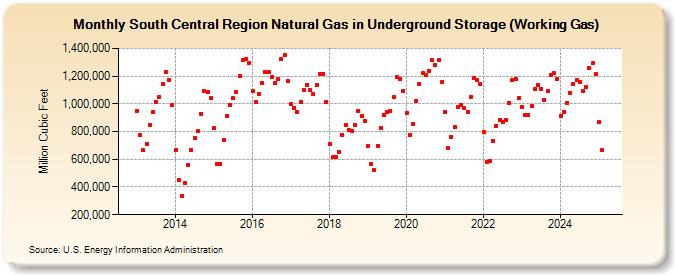
| South Central Region Natural Gas in Underground Storage (Working Gas) (Million Cubic Feet) | |||||
| Year | Jan | Feb | Mar | Apr | May | Jun | Jul | Aug | Sep | Oct | Nov | Dec |
|---|---|---|---|---|---|---|---|---|---|---|---|---|
| 2013 | 950,363 | 777,567 | 664,560 | 713,512 | 847,485 | 938,339 | 1,010,092 | 1,048,763 | 1,141,218 | 1,228,491 | 1,170,772 | 990,744 |
| 2014 | 668,540 | 452,778 | 337,592 | 426,793 | 560,429 | 666,015 | 755,579 | 806,418 | 929,012 | 1,090,604 | 1,084,413 | 1,044,833 |
| 2015 | 823,448 | 567,502 | 566,259 | 740,806 | 911,675 | 992,968 | 1,041,732 | 1,087,544 | 1,198,024 | 1,313,000 | 1,324,084 | 1,295,393 |
| 2016 | 1,089,436 | 1,014,478 | 1,071,277 | 1,150,281 | 1,227,482 | 1,226,637 | 1,192,996 | 1,148,991 | 1,175,818 | 1,324,854 | 1,351,828 | 1,161,910 |
| 2017 | 996,605 | 972,010 | 937,820 | 1,014,331 | 1,102,283 | 1,138,656 | 1,101,540 | 1,068,387 | 1,137,421 | 1,214,368 | 1,218,710 | 1,016,042 |
| 2018 | 709,211 | 614,997 | 613,203 | 648,996 | 777,954 | 845,219 | 813,439 | 802,064 | 845,366 | 948,333 | 913,932 | 879,345 |
| 2019 | 696,523 | 562,561 | 519,045 | 695,035 | 825,669 | 917,256 | 941,727 | 948,794 | 1,049,054 | 1,191,801 | 1,180,446 | 1,094,683 |
| 2020 | 934,551 | 777,989 | 856,996 | 1,021,981 | 1,140,300 | 1,221,228 | 1,206,979 | 1,233,355 | 1,312,670 | 1,280,971 | 1,312,672 | 1,155,134 |
| 2021 | 944,577 | 679,433 | 760,148 | 832,269 | 978,796 | 993,365 | 973,069 | 939,522 | 1,052,735 | 1,184,701 | 1,169,171 | 1,142,665 |
| 2022 | 793,528 | 580,624 | 587,358 | 731,019 | 840,633 | 884,807 | 871,651 | 883,955 | 1,006,276 | 1,170,046 | 1,178,814 | 1,041,965 |
| 2023 | 980,091 | 919,721 | 918,905 | 983,159 | 1,083,886 | 1,137,690 | 1,107,895 | 1,032,083 | 1,092,276 | 1,209,254 | 1,219,444 | 1,182,541 |
| 2024 | 911,725 | 942,841 | 1,007,333 | 1,077,550 | 1,143,296 | 1,171,860 | 1,154,670 | 1,096,098 | 1,120,608 | 1,257,987 | 1,291,538 | 1,215,051 |
| 2025 | 862,503 | 660,475 | 775,413 | 900,126 | 1,049,248 | 1,137,121 | 1,135,268 | 1,127,967 | 1,180,616 | 1,286,189 | 1,330,709 | 1,181,677 |
| 2026 | 855,846 | 717,346 | 795,243 | 897,481 | ||||||||
| - = No Data Reported; -- = Not Applicable; NA = Not Available; W = Withheld to avoid disclosure of individual company data. |
| Release Date: 6/30/2026 |
| Next Release Date: 7/31/2026 |