|
Download Data (XLS File) |
|
|||||
|
|||||
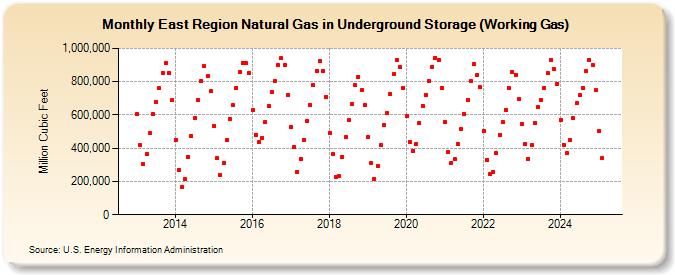
| East Region Natural Gas in Underground Storage (Working Gas) (Million Cubic Feet) | |||||
| Year | Jan | Feb | Mar | Apr | May | Jun | Jul | Aug | Sep | Oct | Nov | Dec |
|---|---|---|---|---|---|---|---|---|---|---|---|---|
| 2013 | 605,224 | 419,836 | 303,741 | 362,496 | 488,370 | 606,051 | 678,197 | 759,995 | 854,238 | 910,008 | 851,251 | 688,716 |
| 2014 | 451,335 | 271,801 | 167,715 | 213,475 | 349,739 | 474,624 | 580,937 | 689,328 | 805,733 | 892,328 | 831,398 | 742,486 |
| 2015 | 533,537 | 338,726 | 239,291 | 308,664 | 451,773 | 572,878 | 657,591 | 762,518 | 856,308 | 915,094 | 910,246 | 852,876 |
| 2016 | 627,868 | 481,191 | 436,461 | 463,353 | 556,928 | 654,325 | 734,844 | 804,403 | 898,349 | 939,614 | 898,594 | 720,849 |
| 2017 | 527,733 | 406,205 | 259,737 | 335,066 | 448,480 | 562,862 | 661,589 | 777,408 | 866,150 | 924,050 | 867,039 | 710,238 |
| 2018 | 492,671 | 363,144 | 229,111 | 231,153 | 348,459 | 464,948 | 569,193 | 663,587 | 778,032 | 830,217 | 750,035 | 659,148 |
| 2019 | 467,721 | 311,511 | 216,223 | 294,222 | 418,642 | 537,444 | 611,437 | 724,874 | 844,647 | 932,381 | 885,821 | 763,806 |
| 2020 | 591,513 | 437,649 | 385,302 | 427,642 | 553,024 | 654,832 | 721,285 | 803,302 | 889,800 | 943,726 | 929,100 | 762,659 |
| 2021 | 557,019 | 377,283 | 312,652 | 333,597 | 425,510 | 514,763 | 604,831 | 688,315 | 804,378 | 904,353 | 841,987 | 765,726 |
| 2022 | 503,010 | 331,683 | 242,151 | 259,299 | 370,637 | 481,845 | 557,353 | 629,062 | 759,003 | 857,323 | 841,905 | 698,235 |
| 2023 | 547,448 | 422,834 | 334,179 | 418,238 | 551,750 | 646,410 | 692,006 | 764,747 | 852,886 | 932,175 | 875,813 | 786,595 |
| 2024 | 571,321 | 421,956 | 368,798 | 448,670 | 579,136 | 670,039 | 719,991 | 763,955 | 862,273 | 932,581 | 900,216 | 747,063 |
| 2025 | 503,647 | 338,784 | 293,751 | 357,706 | 507,492 | 610,327 | 653,837 | 745,296 | 851,114 | 911,004 | 875,094 | 705,421 |
| 2026 | 480,660 | 319,112 | 275,067 | 362,148 | ||||||||
| - = No Data Reported; -- = Not Applicable; NA = Not Available; W = Withheld to avoid disclosure of individual company data. |
| Release Date: 6/30/2026 |
| Next Release Date: 7/31/2026 |