|
Download Data (XLS File) |
|
|||||
|
|||||
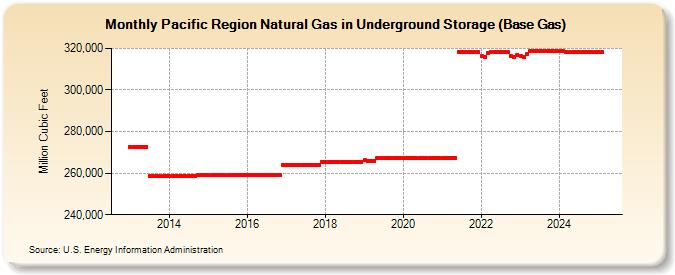
| Pacific Region Natural Gas in Underground Storage (Base Gas) (Million Cubic Feet) | |||||
| Year | Jan | Feb | Mar | Apr | May | Jun | Jul | Aug | Sep | Oct | Nov | Dec |
|---|---|---|---|---|---|---|---|---|---|---|---|---|
| 2013 | 272,719 | 272,719 | 272,719 | 272,719 | 272,719 | 272,719 | 258,434 | 258,434 | 258,434 | 258,434 | 258,434 | 258,736 |
| 2014 | 258,736 | 258,541 | 258,456 | 258,619 | 258,736 | 258,736 | 258,736 | 258,736 | 258,736 | 259,036 | 259,036 | 259,036 |
| 2015 | 259,036 | 259,036 | 259,036 | 259,036 | 259,036 | 259,036 | 259,036 | 259,036 | 259,036 | 259,331 | 259,331 | 259,331 |
| 2016 | 259,331 | 259,331 | 259,331 | 259,331 | 259,331 | 259,331 | 259,331 | 259,331 | 259,331 | 259,331 | 259,331 | 264,091 |
| 2017 | 264,091 | 264,091 | 264,091 | 264,091 | 264,091 | 264,091 | 264,091 | 264,091 | 264,091 | 264,091 | 264,091 | 265,544 |
| 2018 | 265,544 | 265,544 | 265,544 | 265,544 | 265,544 | 265,544 | 265,544 | 265,544 | 265,544 | 265,544 | 265,544 | 265,544 |
| 2019 | 266,178 | 265,688 | 265,688 | 265,688 | 267,324 | 267,324 | 267,324 | 267,324 | 267,324 | 267,324 | 267,324 | 267,324 |
| 2020 | 267,324 | 267,324 | 267,324 | 267,324 | 267,324 | 267,324 | 267,324 | 267,324 | 267,324 | 267,324 | 267,324 | 267,324 |
| 2021 | 267,324 | 267,324 | 267,324 | 267,324 | 267,324 | 318,422 | 318,422 | 318,422 | 318,422 | 318,422 | 318,422 | 318,130 |
| 2022 | 316,244 | 316,058 | 317,971 | 318,422 | 318,422 | 318,422 | 318,422 | 318,391 | 318,422 | 316,148 | 315,723 | 316,922 |
| 2023 | 316,564 | 315,670 | 317,120 | 318,912 | 318,912 | 318,912 | 318,912 | 318,912 | 318,912 | 318,912 | 318,912 | 318,912 |
| 2024 | 318,912 | 318,912 | 318,362 | 318,362 | 318,362 | 318,362 | 318,362 | 318,362 | 318,362 | 318,212 | 318,212 | 318,212 |
| 2025 | 318,212 | 318,212 | 318,212 | 318,212 | 318,212 | 318,212 | 318,212 | 318,212 | 318,212 | 318,212 | 317,992 | 317,992 |
| 2026 | 317,992 | 317,992 | 317,992 | 317,992 | ||||||||
| - = No Data Reported; -- = Not Applicable; NA = Not Available; W = Withheld to avoid disclosure of individual company data. |
| Release Date: 6/30/2026 |
| Next Release Date: 7/31/2026 |