|
Download Data (XLS File) |
|
|||||
|
|||||
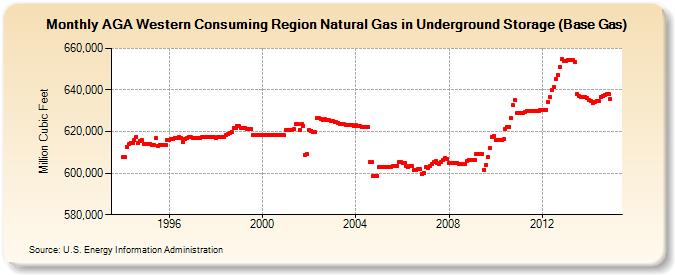
| AGA Western Consuming Region Natural Gas in Underground Storage (Base Gas) (Million Cubic Feet) | |||||
| Year | Jan | Feb | Mar | Apr | May | Jun | Jul | Aug | Sep | Oct | Nov | Dec |
|---|---|---|---|---|---|---|---|---|---|---|---|---|
| 1994 | 607,596 | 607,629 | 612,749 | 613,849 | 614,562 | 614,534 | 615,937 | 617,412 | 614,732 | 615,667 | 615,712 | 613,840 |
| 1995 | 613,874 | 613,874 | 613,898 | 613,357 | 613,699 | 616,811 | 613,151 | 613,413 | 613,504 | 613,752 | 613,514 | 615,837 |
| 1996 | 616,124 | 616,330 | 616,610 | 617,033 | 616,902 | 617,159 | 616,822 | 615,039 | 616,632 | 616,849 | 617,148 | 617,298 |
| 1997 | 617,125 | 617,072 | 617,039 | 617,036 | 617,124 | 617,196 | 617,204 | 617,202 | 617,196 | 617,199 | 617,180 | 617,173 |
| 1998 | 616,676 | 617,392 | 617,342 | 617,287 | 617,264 | 618,270 | 618,760 | 619,541 | 619,710 | 621,631 | 621,599 | 622,473 |
| 1999 | 622,440 | 621,581 | 621,826 | 621,906 | 621,018 | 621,366 | 621,452 | 618,250 | 618,250 | 618,249 | 618,248 | 618,247 |
| 2000 | 618,226 | 618,225 | 618,224 | 618,224 | 618,217 | 618,216 | 618,216 | 618,241 | 618,261 | 618,218 | 618,186 | 618,130 |
| 2001 | 620,851 | 620,813 | 620,931 | 620,960 | 620,996 | 623,495 | 623,495 | 620,790 | 623,493 | 622,791 | 608,793 | 609,034 |
| 2002 | 620,728 | 620,346 | 619,871 | 619,557 | 626,364 | 626,337 | 625,995 | 625,335 | 625,882 | 625,640 | 625,413 | 625,215 |
| 2003 | 624,934 | 624,647 | 624,419 | 624,166 | 623,863 | 623,681 | 623,502 | 623,382 | 623,328 | 623,146 | 622,959 | 622,733 |
| 2004 | 622,987 | 622,564 | 622,456 | 622,361 | 622,286 | 622,223 | 622,205 | 605,327 | 605,463 | 598,494 | 598,394 | 598,405 |
| 2005 | 603,065 | 603,039 | 603,015 | 603,009 | 603,071 | 603,105 | 603,152 | 603,286 | 603,419 | 603,581 | 605,159 | 605,132 |
| 2006 | 605,101 | 605,094 | 603,289 | 603,173 | 603,221 | 603,265 | 601,328 | 601,516 | 601,839 | 602,129 | 599,524 | 600,046 |
| 2007 | 602,740 | 602,623 | 603,273 | 604,439 | 605,287 | 605,749 | 604,868 | 604,564 | 605,261 | 606,336 | 607,146 | 606,949 |
| 2008 | 604,789 | 604,813 | 604,828 | 604,859 | 604,911 | 604,295 | 604,321 | 604,354 | 604,370 | 605,610 | 606,433 | 606,456 |
| 2009 | 606,474 | 606,537 | 609,054 | 609,073 | 609,108 | 609,138 | 601,610 | 603,803 | 607,868 | 612,181 | 617,590 | 617,664 |
| 2010 | 615,838 | 615,862 | 615,891 | 616,001 | 616,269 | 621,336 | 622,042 | 622,360 | 626,752 | 632,633 | 635,034 | 629,066 |
| 2011 | 629,092 | 629,091 | 629,144 | 629,213 | 629,810 | 629,857 | 629,879 | 629,902 | 629,923 | 629,939 | 629,959 | 630,277 |
| 2012 | 630,296 | 630,312 | 630,330 | 634,450 | 636,807 | 639,883 | 641,486 | 645,303 | 647,150 | 650,820 | 654,690 | 654,062 |
| 2013 | 654,155 | 654,469 | 654,468 | 654,446 | 654,471 | 653,417 | 638,005 | 637,108 | 636,504 | 636,595 | 636,593 | 636,129 |
| 2014 | 635,265 | 634,611 | 633,678 | 634,324 | 634,796 | 634,544 | 636,593 | 637,002 | 637,715 | 637,997 | 637,992 | 635,804 |
| - = No Data Reported; -- = Not Applicable; NA = Not Available; W = Withheld to avoid disclosure of individual company data. |
| Release Date: 6/30/2026 |
| Next Release Date: 7/31/2026 |