|
Download Data (XLS File) |
|
|||||
|
|||||
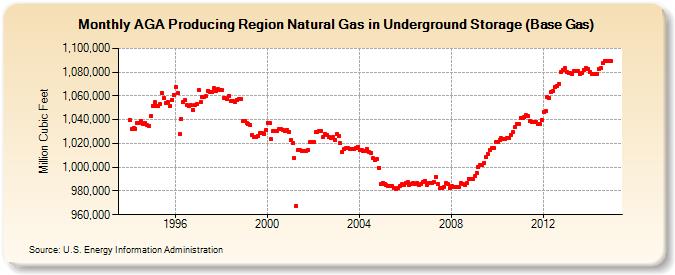
| AGA Producing Region Natural Gas in Underground Storage (Base Gas) (Million Cubic Feet) | |||||
| Year | Jan | Feb | Mar | Apr | May | Jun | Jul | Aug | Sep | Oct | Nov | Dec |
|---|---|---|---|---|---|---|---|---|---|---|---|---|
| 1994 | 1,039,864 | 1,032,160 | 1,033,297 | 1,032,517 | 1,037,294 | 1,037,338 | 1,038,940 | 1,036,193 | 1,037,422 | 1,035,931 | 1,035,050 | 1,043,103 |
| 1995 | 1,051,669 | 1,054,584 | 1,051,120 | 1,051,697 | 1,052,949 | 1,062,613 | 1,058,260 | 1,054,218 | 1,054,870 | 1,051,687 | 1,056,704 | 1,060,588 |
| 1996 | 1,067,220 | 1,062,343 | 1,027,692 | 1,040,511 | 1,055,164 | 1,056,516 | 1,052,009 | 1,051,395 | 1,052,015 | 1,048,151 | 1,052,057 | 1,053,173 |
| 1997 | 1,064,968 | 1,054,977 | 1,059,316 | 1,059,050 | 1,059,706 | 1,064,515 | 1,063,554 | 1,063,029 | 1,066,254 | 1,064,123 | 1,065,557 | 1,065,151 |
| 1998 | 1,064,741 | 1,058,297 | 1,057,927 | 1,057,506 | 1,060,241 | 1,055,941 | 1,055,660 | 1,055,056 | 1,056,417 | 1,057,591 | 1,057,539 | 1,038,925 |
| 1999 | 1,038,910 | 1,037,587 | 1,036,687 | 1,035,711 | 1,026,914 | 1,025,018 | 1,025,184 | 1,026,227 | 1,028,393 | 1,028,423 | 1,028,272 | 1,031,162 |
| 2000 | 1,037,541 | 1,037,178 | 1,023,400 | 1,030,314 | 1,030,622 | 1,030,686 | 1,031,758 | 1,031,794 | 1,031,155 | 1,030,771 | 1,031,638 | 1,030,017 |
| 2001 | 1,022,848 | 1,020,614 | 1,007,780 | 967,342 | 1,014,331 | 1,014,299 | 1,013,680 | 1,013,974 | 1,013,969 | 1,014,678 | 1,020,862 | 1,021,015 |
| 2002 | 1,021,488 | 1,029,805 | 1,029,732 | 1,030,317 | 1,030,651 | 1,025,486 | 1,028,004 | 1,027,490 | 1,025,095 | 1,024,929 | 1,025,412 | 1,023,293 |
| 2003 | 1,027,969 | 1,026,025 | 1,020,107 | 1,012,685 | 1,015,060 | 1,015,864 | 1,015,889 | 1,015,252 | 1,015,602 | 1,015,514 | 1,016,250 | 1,016,833 |
| 2004 | 1,014,871 | 1,014,750 | 1,013,848 | 1,013,236 | 1,014,967 | 1,013,107 | 1,012,254 | 1,007,512 | 1,006,042 | 1,006,506 | 999,531 | 985,481 |
| 2005 | 987,042 | 985,968 | 984,767 | 984,481 | 984,096 | 983,908 | 982,765 | 981,454 | 982,783 | 984,216 | 985,462 | 985,196 |
| 2006 | 986,714 | 987,223 | 984,848 | 985,606 | 986,396 | 986,230 | 986,516 | 984,916 | 985,993 | 987,196 | 988,744 | 985,357 |
| 2007 | 986,444 | 986,411 | 986,784 | 987,138 | 991,971 | 985,805 | 982,252 | 982,534 | 983,591 | 986,662 | 985,553 | 982,480 |
| 2008 | 984,013 | 982,979 | 983,144 | 983,447 | 983,223 | 986,517 | 985,513 | 984,959 | 986,577 | 990,291 | 989,987 | 989,837 |
| 2009 | 992,347 | 995,442 | 1,000,259 | 1,001,752 | 1,002,186 | 1,003,794 | 1,008,481 | 1,010,832 | 1,014,674 | 1,015,736 | 1,016,440 | 1,021,090 |
| 2010 | 1,021,291 | 1,022,975 | 1,024,277 | 1,023,934 | 1,023,362 | 1,024,782 | 1,024,610 | 1,027,423 | 1,029,287 | 1,033,729 | 1,036,450 | 1,036,766 |
| 2011 | 1,041,545 | 1,041,425 | 1,041,979 | 1,043,693 | 1,042,723 | 1,039,180 | 1,037,763 | 1,037,825 | 1,038,406 | 1,036,338 | 1,036,307 | 1,039,842 |
| 2012 | 1,046,326 | 1,047,068 | 1,058,842 | 1,058,372 | 1,063,468 | 1,064,292 | 1,067,542 | 1,068,754 | 1,070,413 | 1,080,062 | 1,082,110 | 1,083,654 |
| 2013 | 1,079,883 | 1,079,642 | 1,079,162 | 1,078,697 | 1,080,968 | 1,080,627 | 1,080,790 | 1,078,248 | 1,079,298 | 1,082,187 | 1,083,365 | 1,082,732 |
| 2014 | 1,080,053 | 1,078,446 | 1,078,409 | 1,078,805 | 1,078,858 | 1,082,611 | 1,083,436 | 1,087,842 | 1,089,725 | 1,089,543 | 1,089,660 | 1,089,228 |
| - = No Data Reported; -- = Not Applicable; NA = Not Available; W = Withheld to avoid disclosure of individual company data. |
| Release Date: 6/30/2026 |
| Next Release Date: 7/31/2026 |