|
Download Data (XLS File) |
|
|||||
|
|||||
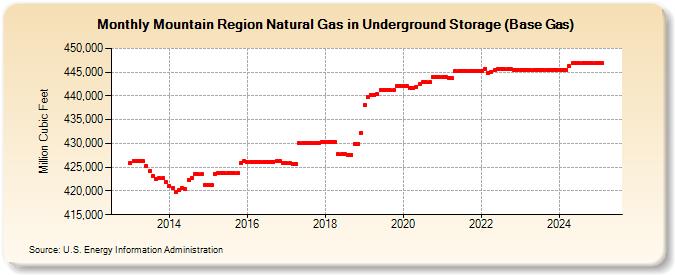
| Mountain Region Natural Gas in Underground Storage (Base Gas) (Million Cubic Feet) | |||||
| Year | Jan | Feb | Mar | Apr | May | Jun | Jul | Aug | Sep | Oct | Nov | Dec |
|---|---|---|---|---|---|---|---|---|---|---|---|---|
| 2013 | 425,980 | 426,295 | 426,294 | 426,272 | 426,297 | 425,243 | 424,116 | 423,218 | 422,615 | 422,706 | 422,704 | 421,938 |
| 2014 | 421,075 | 420,615 | 419,767 | 420,250 | 420,606 | 420,353 | 422,402 | 422,811 | 423,525 | 423,507 | 423,501 | 421,314 |
| 2015 | 421,311 | 421,304 | 423,663 | 423,684 | 423,689 | 423,689 | 423,690 | 423,699 | 423,698 | 423,690 | 425,847 | 426,205 |
| 2016 | 426,151 | 426,075 | 426,050 | 426,104 | 426,133 | 426,165 | 426,157 | 426,145 | 426,136 | 426,318 | 426,282 | 425,908 |
| 2017 | 425,840 | 425,821 | 425,645 | 425,689 | 429,990 | 430,062 | 430,033 | 430,011 | 430,104 | 430,134 | 430,163 | 430,367 |
| 2018 | 430,360 | 430,376 | 430,207 | 430,262 | 427,711 | 427,704 | 427,676 | 427,639 | 427,609 | 429,881 | 429,974 | 432,242 |
| 2019 | 438,133 | 439,783 | 440,267 | 440,262 | 440,389 | 441,187 | 441,190 | 441,190 | 441,190 | 441,164 | 442,133 | 442,118 |
| 2020 | 442,107 | 442,022 | 441,682 | 441,610 | 441,931 | 442,533 | 442,836 | 442,835 | 442,836 | 444,028 | 444,030 | 444,029 |
| 2021 | 444,028 | 444,020 | 443,870 | 443,757 | 445,201 | 445,291 | 445,294 | 445,296 | 445,294 | 445,295 | 445,298 | 445,298 |
| 2022 | 445,292 | 445,683 | 444,897 | 445,131 | 445,377 | 445,584 | 445,584 | 445,583 | 445,573 | 445,563 | 445,550 | 445,550 |
| 2023 | 445,540 | 445,524 | 445,512 | 445,360 | 445,432 | 445,549 | 445,557 | 445,557 | 445,551 | 445,537 | 445,539 | 445,542 |
| 2024 | 445,541 | 445,541 | 445,535 | 446,234 | 446,840 | 446,922 | 446,922 | 446,922 | 446,922 | 446,922 | 446,922 | 446,922 |
| 2025 | 446,922 | 446,922 | 446,922 | 446,922 | 446,902 | 446,873 | 446,845 | 457,086 | 457,085 | 457,420 | 457,543 | 457,543 |
| 2026 | 457,543 | 457,543 | 459,146 | 460,907 | ||||||||
| - = No Data Reported; -- = Not Applicable; NA = Not Available; W = Withheld to avoid disclosure of individual company data. |
| Release Date: 6/30/2026 |
| Next Release Date: 7/31/2026 |