|
Download Data (XLS File) |
|
|||||
|
|||||
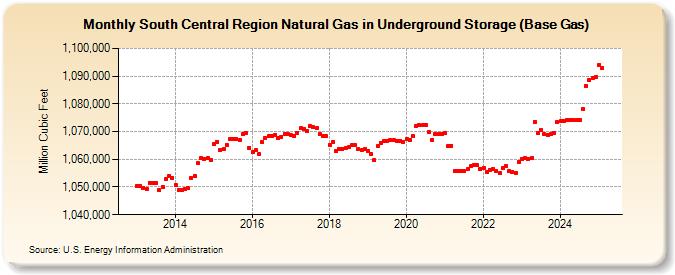
| South Central Region Natural Gas in Underground Storage (Base Gas) (Million Cubic Feet) | |||||
| Year | Jan | Feb | Mar | Apr | May | Jun | Jul | Aug | Sep | Oct | Nov | Dec |
|---|---|---|---|---|---|---|---|---|---|---|---|---|
| 2013 | 1,050,521 | 1,050,280 | 1,049,800 | 1,049,335 | 1,051,606 | 1,051,264 | 1,051,428 | 1,048,886 | 1,049,936 | 1,052,825 | 1,054,003 | 1,053,370 |
| 2014 | 1,050,691 | 1,049,083 | 1,049,047 | 1,049,443 | 1,049,496 | 1,053,249 | 1,054,073 | 1,058,479 | 1,060,363 | 1,060,181 | 1,060,298 | 1,059,866 |
| 2015 | 1,065,580 | 1,066,324 | 1,063,475 | 1,063,647 | 1,065,289 | 1,067,220 | 1,067,375 | 1,067,255 | 1,067,026 | 1,068,949 | 1,069,502 | 1,064,203 |
| 2016 | 1,062,665 | 1,063,181 | 1,061,773 | 1,066,245 | 1,067,616 | 1,068,271 | 1,068,306 | 1,068,764 | 1,067,626 | 1,068,141 | 1,069,116 | 1,069,100 |
| 2017 | 1,068,580 | 1,068,531 | 1,069,623 | 1,071,156 | 1,071,090 | 1,070,143 | 1,071,944 | 1,071,526 | 1,071,122 | 1,069,080 | 1,068,490 | 1,068,240 |
| 2018 | 1,065,228 | 1,066,159 | 1,063,017 | 1,063,710 | 1,063,726 | 1,064,052 | 1,064,256 | 1,064,991 | 1,065,132 | 1,063,619 | 1,063,311 | 1,063,591 |
| 2019 | 1,063,053 | 1,061,858 | 1,059,580 | 1,064,786 | 1,066,045 | 1,066,677 | 1,066,481 | 1,067,034 | 1,066,874 | 1,066,764 | 1,066,697 | 1,066,331 |
| 2020 | 1,067,145 | 1,066,965 | 1,068,262 | 1,072,012 | 1,072,238 | 1,072,261 | 1,072,219 | 1,069,847 | 1,067,109 | 1,069,164 | 1,069,132 | 1,069,111 |
| 2021 | 1,069,339 | 1,064,934 | 1,064,962 | 1,055,729 | 1,055,772 | 1,055,708 | 1,055,672 | 1,056,347 | 1,057,412 | 1,057,896 | 1,057,890 | 1,056,539 |
| 2022 | 1,056,989 | 1,055,411 | 1,056,271 | 1,056,433 | 1,055,780 | 1,054,918 | 1,056,820 | 1,057,591 | 1,055,645 | 1,055,588 | 1,055,126 | 1,058,947 |
| 2023 | 1,060,219 | 1,060,386 | 1,060,220 | 1,060,291 | 1,073,624 | 1,069,483 | 1,070,470 | 1,069,991 | 1,069,481 | 1,072,004 | 1,069,553 | 1,073,525 |
| 2024 | 1,073,105 | 1,073,283 | 1,073,342 | 1,073,449 | 1,073,655 | 1,073,489 | 1,073,366 | 1,077,479 | 1,086,710 | 1,087,862 | 1,088,819 | 1,089,077 |
| 2025 | 1,094,112 | 1,093,208 | 1,094,179 | 1,093,760 | 1,093,427 | 1,093,340 | 1,094,410 | 1,095,375 | 1,094,802 | 1,095,125 | 1,093,830 | 1,092,802 |
| 2026 | 1,091,118 | 1,090,064 | 1,090,407 | 1,092,135 | ||||||||
| - = No Data Reported; -- = Not Applicable; NA = Not Available; W = Withheld to avoid disclosure of individual company data. |
| Release Date: 6/30/2026 |
| Next Release Date: 7/31/2026 |