|
Download Data (XLS File) |
|
|||||
|
|||||
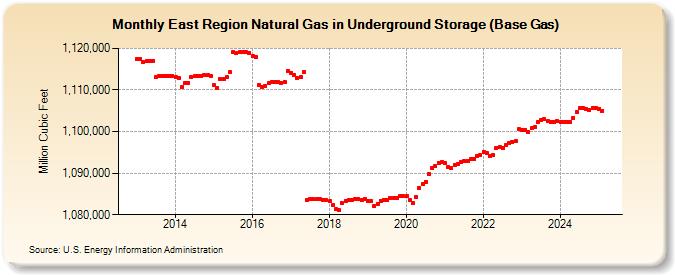
| East Region Natural Gas in Underground Storage (Base Gas) (Million Cubic Feet) | |||||
| Year | Jan | Feb | Mar | Apr | May | Jun | Jul | Aug | Sep | Oct | Nov | Dec |
|---|---|---|---|---|---|---|---|---|---|---|---|---|
| 2013 | 1,117,434 | 1,117,332 | 1,116,711 | 1,116,886 | 1,117,023 | 1,117,057 | 1,113,024 | 1,113,436 | 1,113,408 | 1,113,422 | 1,113,396 | 1,113,414 |
| 2014 | 1,113,096 | 1,112,811 | 1,110,723 | 1,111,592 | 1,111,730 | 1,113,003 | 1,113,262 | 1,113,458 | 1,113,383 | 1,113,607 | 1,113,589 | 1,113,356 |
| 2015 | 1,111,081 | 1,110,574 | 1,112,593 | 1,112,719 | 1,113,055 | 1,114,216 | 1,119,070 | 1,118,884 | 1,119,057 | 1,119,175 | 1,119,046 | 1,119,011 |
| 2016 | 1,118,251 | 1,117,983 | 1,111,252 | 1,110,614 | 1,110,899 | 1,111,616 | 1,111,801 | 1,111,965 | 1,111,941 | 1,111,761 | 1,112,026 | 1,114,530 |
| 2017 | 1,114,143 | 1,113,621 | 1,112,882 | 1,113,159 | 1,114,330 | 1,083,625 | 1,083,701 | 1,083,718 | 1,083,728 | 1,083,734 | 1,083,562 | 1,083,529 |
| 2018 | 1,083,225 | 1,082,410 | 1,081,422 | 1,081,079 | 1,082,788 | 1,083,362 | 1,083,566 | 1,083,566 | 1,083,785 | 1,083,759 | 1,083,571 | 1,083,785 |
| 2019 | 1,083,390 | 1,083,203 | 1,082,194 | 1,082,582 | 1,083,396 | 1,083,643 | 1,083,484 | 1,084,095 | 1,084,095 | 1,084,118 | 1,084,411 | 1,084,414 |
| 2020 | 1,084,385 | 1,083,444 | 1,082,798 | 1,084,339 | 1,086,495 | 1,087,373 | 1,087,966 | 1,089,767 | 1,091,294 | 1,091,694 | 1,092,447 | 1,092,633 |
| 2021 | 1,092,336 | 1,091,528 | 1,091,132 | 1,091,909 | 1,092,227 | 1,092,720 | 1,092,810 | 1,092,990 | 1,093,282 | 1,093,365 | 1,094,151 | 1,094,254 |
| 2022 | 1,095,178 | 1,094,769 | 1,094,144 | 1,094,455 | 1,096,141 | 1,096,175 | 1,096,055 | 1,096,695 | 1,097,156 | 1,097,533 | 1,097,715 | 1,100,523 |
| 2023 | 1,100,493 | 1,100,404 | 1,099,973 | 1,100,796 | 1,101,147 | 1,102,347 | 1,102,696 | 1,102,948 | 1,102,451 | 1,102,180 | 1,102,416 | 1,102,470 |
| 2024 | 1,102,375 | 1,102,374 | 1,102,229 | 1,102,319 | 1,103,283 | 1,104,764 | 1,105,546 | 1,105,722 | 1,105,409 | 1,105,171 | 1,105,784 | 1,105,620 |
| 2025 | 1,105,542 | 1,105,047 | 1,106,300 | 1,106,737 | 1,107,153 | 1,107,399 | 1,107,844 | 1,108,158 | 1,107,792 | 1,107,460 | 1,107,180 | 1,107,342 |
| 2026 | 1,107,392 | 1,106,439 | 1,106,153 | 1,106,710 | ||||||||
| - = No Data Reported; -- = Not Applicable; NA = Not Available; W = Withheld to avoid disclosure of individual company data. |
| Release Date: 6/30/2026 |
| Next Release Date: 7/31/2026 |