|
Download Data (XLS File) |
|
||||||||
|
||||||||
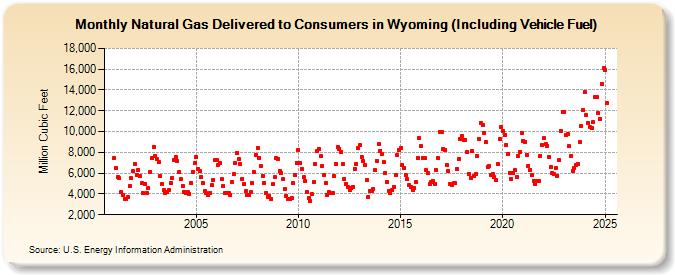
| Natural Gas Delivered to Consumers in Wyoming (Including Vehicle Fuel) (Million Cubic Feet) | ||||||||
| Year | Jan | Feb | Mar | Apr | May | Jun | Jul | Aug | Sep | Oct | Nov | Dec |
|---|---|---|---|---|---|---|---|---|---|---|---|---|
| 2001 | 7,475 | 6,484 | 5,643 | 5,505 | 4,182 | 3,864 | 3,515 | 3,541 | 3,688 | 4,790 | 5,518 | 6,170 |
| 2002 | 6,844 | 5,846 | 6,319 | 5,737 | 5,034 | 4,070 | 4,980 | 4,124 | 4,599 | 6,126 | 7,421 | 8,523 |
| 2003 | 7,672 | 7,313 | 7,026 | 5,737 | 4,976 | 4,408 | 4,112 | 4,164 | 4,356 | 5,062 | 5,554 | 7,236 |
| 2004 | 7,555 | 7,180 | 6,077 | 5,400 | 4,775 | 4,216 | 4,064 | 4,187 | 4,024 | 5,032 | 6,153 | 6,963 |
| 2005 | 7,585 | 6,443 | 6,231 | 5,612 | 5,092 | 4,247 | 4,081 | 3,903 | 4,080 | 4,829 | 5,360 | 7,262 |
| 2006 | 7,304 | 6,824 | 6,957 | 5,389 | 4,762 | 4,109 | 4,108 | 4,063 | 3,935 | 5,157 | 5,893 | 6,958 |
| 2007 | 7,982 | 7,322 | 6,900 | 5,469 | 4,958 | 4,253 | 3,873 | 3,944 | 4,150 | 5,003 | 6,095 | 7,723 |
| 2008 | 8,446 | 7,443 | 6,660 | 5,737 | 5,057 | 4,098 | 3,749 | 3,805 | 3,520 | 4,922 | 5,595 | 7,419 |
| 2009 | 7,385 | 6,193 | 6,026 | 5,396 | 4,491 | 3,839 | 3,500 | 3,525 | 3,568 | 5,046 | 5,806 | 6,986 |
| 2010 | 8,249 | 6,954 | 6,427 | 5,598 | 5,266 | 4,168 | 3,615 | 3,337 | 3,966 | 5,163 | 6,856 | 8,139 |
| 2011 | 8,345 | 7,643 | 6,709 | 5,774 | 5,052 | 3,923 | 4,151 | 4,057 | 4,047 | 5,753 | 6,917 | 8,491 |
| 2012 | 8,335 | 8,064 | 6,901 | 5,483 | 4,935 | 4,666 | 4,331 | 4,537 | 4,692 | 6,433 | 6,911 | 8,399 |
| 2013 | 8,676 | 7,578 | 7,141 | 6,762 | 5,311 | 3,727 | 4,310 | 4,300 | 4,505 | 6,291 | 7,194 | 8,802 |
| 2014 | 8,163 | 7,856 | 7,085 | 6,033 | 5,129 | 4,287 | 4,058 | 4,367 | 4,675 | 5,776 | 7,777 | 8,261 |
| 2015 | 8,407 | 6,818 | 6,520 | 5,824 | 5,393 | 4,830 | 4,709 | 4,418 | 4,558 | 5,109 | 7,474 | 9,372 |
| 2016 | 8,596 | 7,467 | 7,422 | 6,277 | 6,012 | 4,940 | 5,143 | 5,223 | 4,986 | 6,274 | 7,434 | 10,003 |
| 2017 | 9,951 | 8,346 | 8,206 | 6,766 | 6,172 | 5,002 | 4,834 | 5,018 | 5,008 | 6,434 | 7,348 | 9,277 |
| 2018 | 9,582 | 9,228 | 9,202 | 8,022 | 5,946 | 5,541 | 8,119 | 5,728 | 5,927 | 7,663 | 9,299 | 10,833 |
| 2019 | 10,639 | 9,850 | 8,986 | 6,635 | 6,702 | 5,835 | 5,872 | 5,603 | 5,320 | 6,915 | 9,255 | 10,484 |
| 2020 | 10,014 | 9,715 | 8,710 | 7,865 | 6,059 | 5,454 | 5,989 | 6,262 | 5,634 | 7,671 | 8,080 | 9,890 |
| 2021 | 9,067 | 9,022 | 7,751 | 6,720 | 6,317 | 5,808 | 5,270 | 4,954 | 5,204 | 5,282 | 7,676 | 8,704 |
| 2022 | 9,352 | 8,772 | 8,635 | 7,559 | 6,573 | 5,991 | 5,894 | 6,520 | 5,758 | 7,284 | 10,088 | 11,868 |
| 2023 | 11,915 | 9,673 | 9,733 | 8,464 | 7,620 | 6,100 | 6,433 | 6,642 | 6,816 | 8,871 | 10,487 | 12,122 |
| 2024 | 13,106 | 11,024 | 10,338 | 10,030 | 9,832 | 10,492 | 13,017 | 13,068 | 11,511 | 10,992 | 14,079 | 15,504 |
| 2025 | 16,892 | 12,954 | 11,617 | 10,935 | 10,155 | 10,640 | 11,751 | 12,682 | 9,545 | 9,741 | 13,617 | 12,805 |
| 2026 | 13,641 | 12,319 | 11,724 | 11,312 | ||||||||
| - = No Data Reported; -- = Not Applicable; NA = Not Available; W = Withheld to avoid disclosure of individual company data. |
| Release Date: 6/30/2026 |
| Next Release Date: 7/31/2026 |