|
Download Data (XLS File) |
|
||||||||
|
||||||||
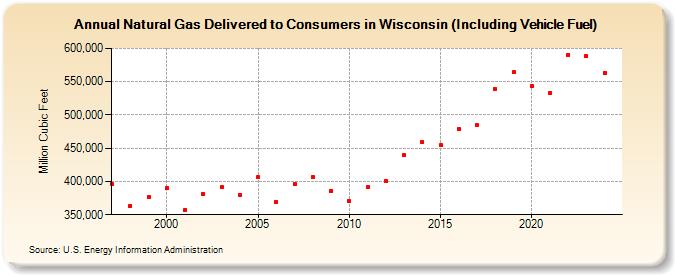
| Natural Gas Delivered to Consumers in Wisconsin (Including Vehicle Fuel) (Million Cubic Feet) | ||||||||
| Decade | Year-0 | Year-1 | Year-2 | Year-3 | Year-4 | Year-5 | Year-6 | Year-7 | Year-8 | Year-9 |
|---|---|---|---|---|---|---|---|---|---|---|
| 1990's | 396,107 | 363,738 | 376,409 | |||||||
| 2000's | 389,543 | 356,915 | 381,498 | 391,185 | 380,014 | 406,550 | 369,353 | 395,519 | 406,723 | 385,418 |
| 2010's | 369,924 | 391,128 | 400,876 | 439,741 | 459,490 | 454,356 | 478,626 | 484,150 | 539,098 | 564,501 |
| 2020's | 544,023 | 533,252 | 590,568 | 568,424 | 560,118 | 586,148 |
| - = No Data Reported; -- = Not Applicable; NA = Not Available; W = Withheld to avoid disclosure of individual company data. |
| Release Date: 6/30/2026 |
| Next Release Date: 7/31/2026 |