|
Download Data (XLS File) |
|
||||||||
|
||||||||
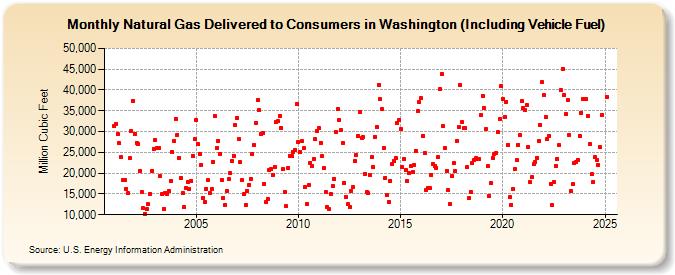
| Natural Gas Delivered to Consumers in Washington (Including Vehicle Fuel) (Million Cubic Feet) | ||||||||
| Year | Jan | Feb | Mar | Apr | May | Jun | Jul | Aug | Sep | Oct | Nov | Dec |
|---|---|---|---|---|---|---|---|---|---|---|---|---|
| 2001 | 31,231 | 31,904 | 29,422 | 27,137 | 23,855 | 18,345 | 18,349 | 16,283 | 15,107 | 23,527 | 30,172 | 37,445 |
| 2002 | 29,531 | 27,361 | 27,117 | 20,531 | 15,439 | 11,596 | 10,256 | 11,367 | 12,459 | 15,045 | 20,551 | 25,818 |
| 2003 | 27,912 | 26,079 | 26,003 | 19,269 | 14,939 | 11,471 | 15,334 | 15,006 | 15,698 | 18,116 | 25,119 | 27,774 |
| 2004 | 33,107 | 29,246 | 23,696 | 18,926 | 15,242 | 11,848 | 16,510 | 17,954 | 16,165 | 18,170 | 24,172 | 28,231 |
| 2005 | 32,764 | 27,001 | 24,695 | 21,951 | 14,060 | 13,150 | 16,232 | 18,247 | 15,311 | 16,197 | 22,774 | 33,671 |
| 2006 | 26,071 | 27,834 | 24,614 | 18,361 | 14,131 | 12,401 | 15,757 | 18,487 | 19,953 | 22,942 | 24,231 | 31,558 |
| 2007 | 33,243 | 28,254 | 22,572 | 18,271 | 14,867 | 12,369 | 15,782 | 17,194 | 18,664 | 24,544 | 26,791 | 32,155 |
| 2008 | 37,581 | 35,133 | 29,522 | 29,561 | 17,495 | 12,939 | 13,765 | 20,653 | 21,027 | 19,531 | 21,589 | 32,246 |
| 2009 | 32,461 | 33,791 | 30,907 | 20,922 | 15,567 | 12,035 | 21,308 | 24,156 | 24,013 | 25,070 | 25,521 | 36,670 |
| 2010 | 27,562 | 25,029 | 27,612 | 25,969 | 16,623 | 12,518 | 17,042 | 22,487 | 21,668 | 23,399 | 28,126 | 30,104 |
| 2011 | 30,787 | 27,340 | 24,029 | 21,174 | 15,426 | 11,754 | 11,325 | 15,038 | 17,018 | 18,679 | 29,977 | 35,398 |
| 2012 | 32,832 | 30,280 | 27,281 | 17,724 | 14,329 | 12,491 | 11,799 | 15,774 | 16,627 | 22,937 | 24,246 | 29,036 |
| 2013 | 34,596 | 28,421 | 28,667 | 19,872 | 15,358 | 15,105 | 19,525 | 23,923 | 21,514 | 28,757 | 31,101 | 41,309 |
| 2014 | 37,827 | 35,349 | 26,018 | 18,875 | 14,675 | 13,153 | 18,214 | 22,185 | 22,926 | 23,639 | 32,117 | 32,680 |
| 2015 | 30,508 | 21,525 | 23,430 | 20,853 | 18,051 | 20,046 | 21,691 | 20,291 | 22,065 | 25,415 | 34,844 | 36,997 |
| 2016 | 38,006 | 29,006 | 24,887 | 15,916 | 16,340 | 16,373 | 19,605 | 22,237 | 21,829 | 21,200 | 23,838 | 40,216 |
| 2017 | 43,918 | 31,239 | 26,011 | 20,546 | 15,855 | 12,537 | 19,349 | 22,437 | 20,554 | 27,787 | 31,083 | 41,255 |
| 2018 | 32,215 | 30,868 | 30,798 | 21,432 | 14,000 | 15,534 | 22,460 | 23,059 | 23,521 | 23,397 | 23,357 | 33,972 |
| 2019 | 38,647 | 35,598 | 30,520 | 21,646 | 14,605 | 17,516 | 23,714 | 24,654 | 24,835 | 29,817 | 32,978 | 40,939 |
| 2020 | 37,902 | 33,507 | 37,207 | 26,833 | 14,259 | 12,421 | 16,070 | 20,932 | 23,118 | 26,843 | 29,170 | 37,308 |
| 2021 | 35,756 | 35,176 | 36,337 | 26,267 | 17,765 | 18,991 | 22,131 | 22,703 | 23,711 | 27,741 | 31,692 | 41,854 |
| 2022 | 38,714 | 33,475 | 28,236 | 28,890 | 17,506 | 12,228 | 17,847 | 21,766 | 23,471 | 26,674 | 39,934 | 45,104 |
| 2023 | 40,827 | 35,952 | 39,600 | 30,017 | 13,898 | 16,179 | 22,253 | 23,563 | 24,831 | 30,752 | 36,753 | 39,584 |
| 2024 | 44,317 | 37,880 | 34,221 | 27,412 | 16,850 | 16,351 | 22,568 | 22,424 | 21,859 | 26,716 | 34,558 | 39,784 |
| 2025 | 42,644 | 37,823 | 30,106 | 22,867 | 18,206 | 20,319 | 22,569 | 21,221 | NA | NA | 27,486 | NA |
| 2026 | 33,137 | 28,113 | 26,995 | 19,196 | ||||||||
| - = No Data Reported; -- = Not Applicable; NA = Not Available; W = Withheld to avoid disclosure of individual company data. |
| Release Date: 6/30/2026 |
| Next Release Date: 7/31/2026 |