|
Download Data (XLS File) |
|
||||||||
|
||||||||
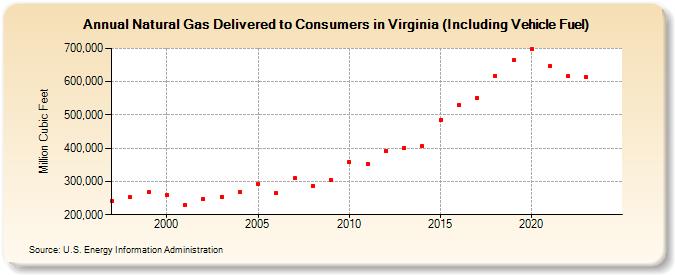
| Natural Gas Delivered to Consumers in Virginia (Including Vehicle Fuel) (Million Cubic Feet) | ||||||||
| Decade | Year-0 | Year-1 | Year-2 | Year-3 | Year-4 | Year-5 | Year-6 | Year-7 | Year-8 | Year-9 |
|---|---|---|---|---|---|---|---|---|---|---|
| 1990's | 240,244 | 252,233 | 267,269 | |||||||
| 2000's | 258,975 | 228,670 | 247,351 | 254,008 | 268,674 | 292,043 | 264,954 | 309,866 | 286,497 | 304,266 |
| 2010's | 359,208 | 352,281 | 392,255 | 401,623 | 405,383 | 484,836 | 528,331 | 551,462 | 618,001 | 663,981 |
| 2020's | 697,298 | 647,543 | 615,925 | 609,110 | 686,633 | 709,207 |
| - = No Data Reported; -- = Not Applicable; NA = Not Available; W = Withheld to avoid disclosure of individual company data. |
| Release Date: 6/30/2026 |
| Next Release Date: 7/31/2026 |