|
Download Data (XLS File) |
|
||||||||
|
||||||||
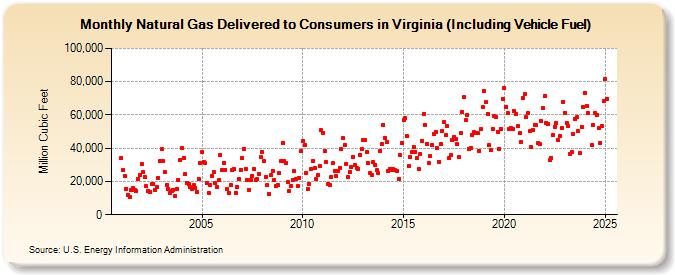
| Natural Gas Delivered to Consumers in Virginia (Including Vehicle Fuel) (Million Cubic Feet) | ||||||||
| Year | Jan | Feb | Mar | Apr | May | Jun | Jul | Aug | Sep | Oct | Nov | Dec |
|---|---|---|---|---|---|---|---|---|---|---|---|---|
| 2001 | 34,325 | 27,001 | 23,081 | 15,728 | 11,714 | 10,937 | 14,866 | 15,873 | 15,145 | 14,257 | 21,748 | 23,733 |
| 2002 | 30,728 | 25,956 | 22,525 | 16,988 | 14,493 | 13,877 | 18,202 | 18,373 | 14,992 | 16,512 | 22,349 | 32,089 |
| 2003 | 39,589 | 32,153 | 25,608 | 18,114 | 15,312 | 12,832 | 14,519 | 15,084 | 11,238 | 15,259 | 21,050 | 32,921 |
| 2004 | 40,135 | 33,982 | 24,192 | 18,779 | 18,241 | 16,500 | 15,667 | 17,654 | 16,341 | 13,924 | 21,649 | 31,243 |
| 2005 | 37,448 | 31,508 | 31,147 | 18,853 | 12,905 | 18,009 | 23,552 | 25,949 | 18,966 | 16,884 | 20,579 | 36,086 |
| 2006 | 27,027 | 31,003 | 26,918 | 15,287 | 13,141 | 18,076 | 26,876 | 27,756 | 13,251 | 16,950 | 21,597 | 26,903 |
| 2007 | 34,027 | 39,663 | 27,661 | 20,576 | 15,014 | 20,884 | 23,201 | 27,420 | 20,949 | 21,281 | 24,275 | 34,762 |
| 2008 | 37,572 | 32,154 | 22,857 | 17,596 | 12,653 | 23,842 | 26,531 | 20,705 | 16,972 | 18,107 | 24,995 | 32,372 |
| 2009 | 43,163 | 32,206 | 31,322 | 19,487 | 14,535 | 17,216 | 21,115 | 26,186 | 21,346 | 17,041 | 22,356 | 38,154 |
| 2010 | 44,329 | 41,811 | 25,112 | 15,205 | 18,735 | 27,549 | 32,467 | 28,314 | 21,392 | 24,100 | 29,429 | 50,766 |
| 2011 | 49,416 | 38,032 | 31,635 | 18,585 | 17,885 | 22,826 | 30,825 | 26,512 | 23,186 | 26,164 | 27,977 | 39,237 |
| 2012 | 46,029 | 41,921 | 30,696 | 22,639 | 25,900 | 28,781 | 34,992 | 29,797 | 28,155 | 27,583 | 36,149 | 39,613 |
| 2013 | 45,167 | 44,731 | 37,575 | 30,981 | 25,022 | 23,732 | 31,643 | 30,168 | 26,603 | 25,279 | 38,217 | 42,505 |
| 2014 | 53,990 | 46,415 | 43,424 | 26,519 | 27,337 | 27,040 | 27,246 | 26,830 | 26,215 | 21,327 | 36,115 | 42,925 |
| 2015 | 56,711 | 58,062 | 47,104 | 29,204 | 34,839 | 37,862 | 40,618 | 37,663 | 34,381 | 27,441 | 36,525 | 44,426 |
| 2016 | 60,715 | 53,844 | 42,386 | 31,321 | 35,152 | 41,696 | 48,466 | 49,929 | 40,093 | 31,929 | 42,442 | 50,358 |
| 2017 | 55,663 | 48,001 | 53,629 | 33,919 | 35,705 | 44,730 | 46,923 | 45,335 | 42,469 | 34,458 | 48,853 | 61,779 |
| 2018 | 71,001 | 56,811 | 60,146 | 39,630 | 40,287 | 47,885 | 49,533 | 49,092 | 49,256 | 38,160 | 51,489 | 64,712 |
| 2019 | 74,538 | 67,606 | 60,831 | 41,776 | 38,625 | 51,555 | 59,478 | 58,502 | 50,012 | 39,609 | 51,714 | 69,735 |
| 2020 | 76,015 | 65,024 | 61,344 | 51,478 | 52,141 | 51,790 | 62,373 | 60,703 | 53,183 | 48,835 | 43,998 | 70,414 |
| 2021 | 72,405 | 58,535 | 61,135 | 50,304 | 40,666 | 51,079 | 53,963 | 53,729 | 43,374 | 42,284 | 56,153 | 63,915 |
| 2022 | 71,424 | 55,144 | 54,377 | 32,716 | 34,167 | 47,921 | 52,919 | 55,120 | 44,682 | 47,174 | 52,406 | 67,872 |
| 2023 | 61,753 | 54,971 | 53,109 | 37,656 | 37,647 | 46,912 | 56,288 | 56,618 | 49,653 | 37,952 | 52,786 | 63,764 |
| 2024 | 74,191 | 66,344 | 61,852 | 44,817 | 42,714 | 53,772 | 63,863 | 59,932 | 52,621 | 43,007 | 53,364 | 70,155 |
| 2025 | 86,390 | 70,656 | 61,302 | 42,114 | 41,796 | 57,840 | 63,650 | 61,564 | 50,880 | 41,926 | 51,715 | 79,373 |
| 2026 | 83,796 | 72,700 | 52,924 | NA | ||||||||
| - = No Data Reported; -- = Not Applicable; NA = Not Available; W = Withheld to avoid disclosure of individual company data. |
| Release Date: 6/30/2026 |
| Next Release Date: 7/31/2026 |