|
Download Data (XLS File) |
|
||||||||
|
||||||||
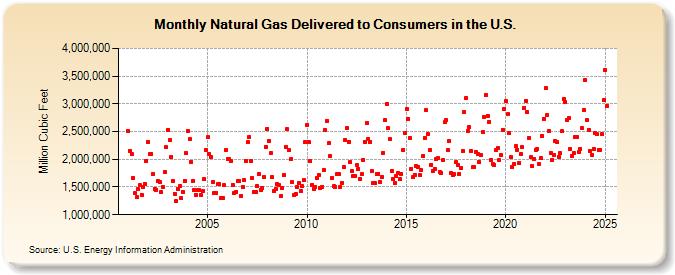
| Natural Gas Delivered to Consumers in the U.S. (Million Cubic Feet) | ||||||||
| Year | Jan | Feb | Mar | Apr | May | Jun | Jul | Aug | Sep | Oct | Nov | Dec |
|---|---|---|---|---|---|---|---|---|---|---|---|---|
| 2001 | 2,505,011 | 2,156,873 | 2,086,568 | 1,663,832 | 1,385,163 | 1,313,119 | 1,459,919 | 1,528,483 | 1,360,871 | 1,507,428 | 1,561,970 | 1,965,873 |
| 2002 | 2,319,273 | 2,090,786 | 2,096,915 | 1,734,549 | 1,470,504 | 1,453,967 | 1,602,849 | 1,582,079 | 1,408,599 | 1,506,936 | 1,766,395 | 2,214,167 |
| 2003 | 2,532,736 | 2,346,489 | 2,041,522 | 1,603,853 | 1,379,497 | 1,240,196 | 1,464,704 | 1,512,522 | 1,299,128 | 1,417,234 | 1,616,154 | 2,108,690 |
| 2004 | 2,512,844 | 2,358,946 | 1,952,607 | 1,609,746 | 1,441,557 | 1,356,266 | 1,452,339 | 1,445,892 | 1,357,712 | 1,426,546 | 1,647,979 | 2,176,020 |
| 2005 | 2,396,713 | 2,094,357 | 2,048,169 | 1,585,188 | 1,386,917 | 1,400,018 | 1,547,608 | 1,555,887 | 1,301,829 | 1,302,758 | 1,529,693 | 2,169,754 |
| 2006 | 2,010,926 | 1,999,359 | 1,972,165 | 1,543,302 | 1,390,353 | 1,415,134 | 1,615,241 | 1,607,830 | 1,328,565 | 1,501,925 | 1,622,364 | 1,965,718 |
| 2007 | 2,306,943 | 2,403,778 | 1,967,388 | 1,662,412 | 1,414,428 | 1,413,254 | 1,513,157 | 1,741,755 | 1,446,674 | 1,479,110 | 1,681,149 | 2,225,994 |
| 2008 | 2,554,281 | 2,335,770 | 2,109,623 | 1,672,724 | 1,430,242 | 1,459,015 | 1,556,011 | 1,531,863 | 1,329,726 | 1,488,645 | 1,714,971 | 2,226,478 |
| 2009 | 2,538,368 | 2,162,215 | 1,996,245 | 1,585,512 | 1,353,150 | 1,378,772 | 1,503,321 | 1,578,354 | 1,427,135 | 1,510,867 | 1,619,852 | 2,310,875 |
| 2010 | 2,624,217 | 2,312,746 | 1,974,222 | 1,540,128 | 1,465,089 | 1,500,962 | 1,668,244 | 1,718,550 | 1,485,061 | 1,506,234 | 1,809,151 | 2,522,442 |
| 2011 | 2,699,039 | 2,285,465 | 2,056,105 | 1,665,278 | 1,509,295 | 1,503,845 | 1,728,010 | 1,727,907 | 1,500,242 | 1,579,772 | 1,860,159 | 2,351,937 |
| 2012 | 2,557,465 | 2,319,221 | 1,949,890 | 1,784,460 | 1,703,507 | 1,702,557 | 1,891,318 | 1,832,775 | 1,640,347 | 1,727,393 | 1,989,660 | 2,312,832 |
| 2013 | 2,661,816 | 2,371,983 | 2,316,191 | 1,783,603 | 1,572,373 | 1,567,216 | 1,738,157 | 1,739,436 | 1,588,718 | 1,680,814 | 2,118,508 | 2,700,111 |
| 2014 | 2,997,145 | 2,556,038 | 2,365,293 | 1,786,764 | 1,636,202 | 1,576,508 | 1,701,744 | 1,751,644 | 1,635,485 | 1,730,740 | 2,167,984 | 2,475,535 |
| 2015 | 2,903,574 | 2,730,693 | 2,392,542 | 1,826,933 | 1,678,755 | 1,723,906 | 1,882,675 | 1,867,936 | 1,723,960 | 1,804,380 | 2,064,029 | 2,389,902 |
| 2016 | 2,880,714 | 2,459,545 | 2,164,467 | 1,903,501 | 1,785,885 | 1,825,125 | 2,001,036 | 2,023,229 | 1,774,412 | 1,748,897 | 1,979,957 | 2,665,391 |
| 2017 | 2,708,217 | 2,161,185 | 2,324,198 | 1,753,578 | 1,710,548 | 1,731,387 | 1,950,510 | 1,904,112 | 1,737,701 | 1,838,965 | 2,155,805 | 2,858,509 |
| 2018 | 3,107,734 | 2,507,085 | 2,576,005 | 2,148,089 | 1,855,856 | 1,867,447 | 2,139,037 | 2,100,482 | 1,949,898 | 2,069,201 | 2,488,282 | 2,759,042 |
| 2019 | 3,161,732 | 2,783,640 | 2,680,848 | 1,994,279 | 1,912,779 | 1,902,995 | 2,162,450 | 2,197,474 | 1,982,049 | 2,072,599 | 2,535,754 | 2,904,407 |
| 2020 | 3,052,335 | 2,809,540 | 2,475,096 | 2,035,122 | 1,861,283 | 1,917,555 | 2,234,989 | 2,173,203 | 1,938,029 | 2,093,493 | 2,215,375 | 2,924,939 |
| 2021 | 3,056,278 | 2,850,394 | 2,387,023 | 2,036,708 | 1,882,870 | 2,008,918 | 2,171,329 | 2,188,822 | 1,906,377 | 2,015,381 | 2,427,617 | 2,731,775 |
| 2022 | 3,287,895 | 2,793,006 | 2,516,726 | 2,114,010 | 1,995,895 | 2,074,067 | 2,329,216 | 2,306,262 | 2,047,010 | 2,108,275 | 2,502,928 | 3,084,994 |
| 2023 | 3,026,049 | 2,697,017 | 2,747,231 | 2,170,302 | 2,058,921 | 2,119,058 | 2,406,370 | 2,415,973 | 2,136,052 | 2,184,994 | 2,555,269 | 2,891,823 |
| 2024 | 3,420,059 | 2,694,733 | 2,528,578 | 2,150,217 | 2,086,595 | 2,177,855 | 2,473,603 | 2,453,521 | 2,164,723 | 2,171,789 | 2,443,970 | 3,061,078 |
| 2025 | 3,603,349 | 2,955,867 | 2,472,170 | 2,118,974 | 2,047,388 | 2,155,397 | 2,444,084 | 2,365,356 | 2,163,558 | 2,175,493 | 2,502,941 | 3,183,876 |
| 2026 | 3,468,646 | 2,832,003 | 2,493,529 | 2,123,906 | ||||||||
| - = No Data Reported; -- = Not Applicable; NA = Not Available; W = Withheld to avoid disclosure of individual company data. |
| Release Date: 6/30/2026 |
| Next Release Date: 7/31/2026 |