|
Download Data (XLS File) |
|
||||||||
|
||||||||
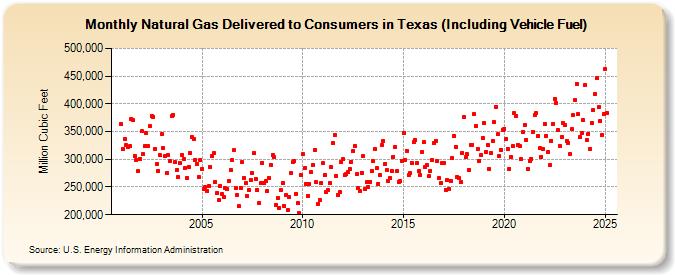
| Natural Gas Delivered to Consumers in Texas (Including Vehicle Fuel) (Million Cubic Feet) | ||||||||
| Year | Jan | Feb | Mar | Apr | May | Jun | Jul | Aug | Sep | Oct | Nov | Dec |
|---|---|---|---|---|---|---|---|---|---|---|---|---|
| 2001 | 362,844 | 318,006 | 336,664 | 325,130 | 322,975 | 323,054 | 373,497 | 369,956 | 306,053 | 298,861 | 278,385 | 300,793 |
| 2002 | 350,229 | 309,217 | 323,520 | 347,110 | 323,045 | 359,334 | 378,700 | 376,676 | 319,061 | 291,387 | 278,990 | 307,430 |
| 2003 | 344,839 | 320,745 | 306,409 | 274,512 | 307,569 | 296,723 | 377,943 | 379,876 | 294,294 | 281,431 | 267,757 | 293,156 |
| 2004 | 308,056 | 300,833 | 284,762 | 266,451 | 286,412 | 311,889 | 339,873 | 336,875 | 299,518 | 291,473 | 268,077 | 298,771 |
| 2005 | 283,104 | 246,886 | 249,246 | 243,251 | 251,559 | 286,763 | 305,006 | 310,731 | 259,546 | 239,477 | 225,717 | 251,536 |
| 2006 | 236,862 | 231,398 | 247,349 | 247,167 | 261,204 | 280,602 | 297,878 | 316,009 | 247,693 | 236,029 | 214,986 | 248,960 |
| 2007 | 294,538 | 265,739 | 258,041 | 233,339 | 244,328 | 262,865 | 274,368 | 311,008 | 264,388 | 244,064 | 221,873 | 257,039 |
| 2008 | 294,086 | 256,910 | 260,946 | 241,947 | 266,053 | 289,696 | 307,787 | 303,775 | 218,029 | 230,200 | 212,172 | 244,771 |
| 2009 | 257,541 | 215,156 | 235,391 | 208,076 | 232,073 | 274,564 | 294,297 | 296,292 | 238,040 | 220,295 | 202,412 | 271,224 |
| 2010 | 309,100 | 284,654 | 256,046 | 234,470 | 256,015 | 276,401 | 289,856 | 316,480 | 258,383 | 219,954 | 226,057 | 257,594 |
| 2011 | 292,533 | 271,389 | 241,348 | 244,891 | 257,032 | 285,347 | 328,964 | 344,214 | 270,212 | 234,893 | 240,190 | 294,715 |
| 2012 | 299,627 | 271,554 | 272,575 | 277,545 | 281,571 | 295,925 | 314,589 | 323,754 | 272,945 | 247,719 | 243,655 | 275,758 |
| 2013 | 305,793 | 246,719 | 258,530 | 250,057 | 259,206 | 278,603 | 296,074 | 318,113 | 283,822 | 256,264 | 271,913 | 325,552 |
| 2014 | 332,920 | 291,978 | 280,010 | 260,005 | 266,265 | 279,037 | 304,999 | 322,822 | 278,723 | 259,428 | 260,922 | 297,357 |
| 2015 | 348,119 | 297,837 | 315,617 | 271,023 | 274,677 | 292,544 | 330,573 | 334,353 | 292,889 | 278,831 | 271,193 | 313,833 |
| 2016 | 330,283 | 285,885 | 289,057 | 269,291 | 279,180 | 298,407 | 328,972 | 333,459 | 296,870 | 266,076 | 257,158 | 292,696 |
| 2017 | 294,170 | 245,170 | 262,085 | 246,920 | 261,700 | 301,718 | 342,023 | 322,888 | 268,180 | 265,716 | 258,233 | 310,944 |
| 2018 | 375,409 | 303,251 | 308,880 | 281,514 | 326,264 | 326,543 | 380,917 | 360,546 | 318,178 | 297,020 | 307,654 | 339,066 |
| 2019 | 365,667 | 313,223 | 326,480 | 282,466 | 311,077 | 333,719 | 366,865 | 395,153 | 345,113 | 306,062 | 316,328 | 352,155 |
| 2020 | 355,491 | 336,812 | 318,743 | 283,285 | 304,441 | 323,642 | 382,868 | 378,367 | 326,393 | 323,706 | 299,797 | 349,158 |
| 2021 | 361,903 | 335,215 | 282,860 | 297,643 | 301,182 | 349,278 | 379,649 | 382,962 | 341,704 | 319,987 | 304,836 | 318,849 |
| 2022 | 364,425 | 342,351 | 313,286 | 289,525 | 333,692 | 364,046 | 408,563 | 400,647 | 352,641 | 324,802 | 340,225 | 364,669 |
| 2023 | 360,208 | 331,215 | 328,859 | 309,482 | 358,343 | 389,806 | 419,665 | 454,990 | 394,687 | 345,810 | 349,943 | 371,356 |
| 2024 | 432,077 | 331,012 | 347,611 | 322,398 | 369,316 | 391,504 | 416,234 | 452,832 | 391,829 | 369,138 | 343,466 | 380,820 |
| 2025 | 459,813 | 379,931 | 322,428 | 323,775 | 370,506 | 375,473 | 408,516 | 428,928 | 392,402 | 361,183 | 342,670 | 386,248 |
| 2026 | 423,181 | 332,475 | 337,261 | 339,405 | ||||||||
| - = No Data Reported; -- = Not Applicable; NA = Not Available; W = Withheld to avoid disclosure of individual company data. |
| Release Date: 6/30/2026 |
| Next Release Date: 7/31/2026 |