|
Download Data (XLS File) |
|
||||||||
|
||||||||
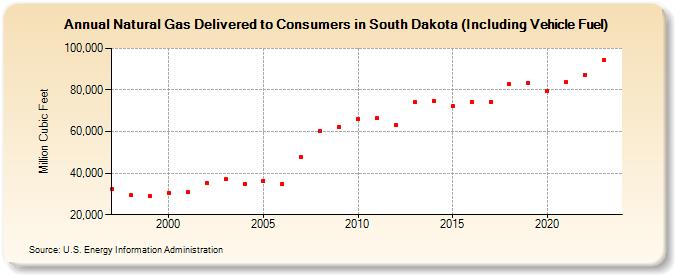
| Natural Gas Delivered to Consumers in South Dakota (Including Vehicle Fuel) (Million Cubic Feet) | ||||||||
| Decade | Year-0 | Year-1 | Year-2 | Year-3 | Year-4 | Year-5 | Year-6 | Year-7 | Year-8 | Year-9 |
|---|---|---|---|---|---|---|---|---|---|---|
| 1990's | 32,294 | 29,390 | 28,910 | |||||||
| 2000's | 30,667 | 30,766 | 35,018 | 37,011 | 34,900 | 36,259 | 34,809 | 47,675 | 60,026 | 62,376 |
| 2010's | 66,195 | 66,320 | 62,969 | 74,182 | 74,593 | 72,407 | 74,082 | 74,313 | 82,924 | 83,328 |
| 2020's | 79,414 | 83,821 | 85,104 | 89,247 | 89,103 | 88,811 |
| - = No Data Reported; -- = Not Applicable; NA = Not Available; W = Withheld to avoid disclosure of individual company data. |
| Release Date: 6/30/2026 |
| Next Release Date: 7/31/2026 |