|
Download Data (XLS File) |
|
||||||||
|
||||||||
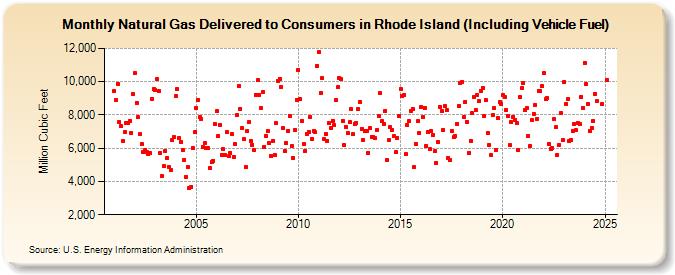
| Natural Gas Delivered to Consumers in Rhode Island (Including Vehicle Fuel) (Million Cubic Feet) | ||||||||
| Year | Jan | Feb | Mar | Apr | May | Jun | Jul | Aug | Sep | Oct | Nov | Dec |
|---|---|---|---|---|---|---|---|---|---|---|---|---|
| 2001 | 9,425 | 8,875 | 9,886 | 7,566 | 7,317 | 6,419 | 6,971 | 7,536 | 7,493 | 7,652 | 6,918 | 9,231 |
| 2002 | 10,511 | 8,745 | 7,848 | 6,823 | 6,244 | 5,757 | 5,873 | 5,748 | 5,630 | 5,720 | 8,981 | 9,553 |
| 2003 | 9,510 | 10,141 | 9,429 | 5,721 | 4,332 | 4,902 | 5,830 | 5,423 | 4,891 | 4,709 | 6,468 | 6,670 |
| 2004 | 9,122 | 9,552 | 6,607 | 6,373 | 5,874 | 5,299 | 4,296 | 4,885 | 3,594 | 3,675 | 6,015 | 6,955 |
| 2005 | 8,403 | 8,917 | 7,847 | 7,729 | 6,062 | 6,293 | 5,990 | 6,010 | 4,836 | 5,169 | 5,246 | 7,434 |
| 2006 | 8,207 | 6,737 | 7,405 | 5,579 | 5,935 | 5,619 | 6,982 | 5,512 | 5,724 | 6,845 | 5,472 | 6,230 |
| 2007 | 7,988 | 9,766 | 8,374 | 7,190 | 6,533 | 4,869 | 7,009 | 7,571 | 6,437 | 6,185 | 5,880 | 9,217 |
| 2008 | 10,073 | 9,216 | 8,387 | 9,366 | 6,092 | 6,760 | 7,028 | 6,288 | 5,544 | 6,433 | 5,614 | 7,492 |
| 2009 | 10,057 | 10,178 | 9,675 | 7,190 | 5,817 | 6,299 | 7,057 | 7,944 | 6,114 | 5,399 | 7,119 | 8,908 |
| 2010 | 10,715 | 8,947 | 7,652 | 6,243 | 5,810 | 6,873 | 7,001 | 7,886 | 6,545 | 7,059 | 6,949 | 10,964 |
| 2011 | 11,811 | 9,306 | 10,198 | 6,533 | 6,880 | 6,434 | 7,509 | 7,204 | 7,663 | 7,374 | 8,891 | 9,650 |
| 2012 | 10,217 | 10,135 | 7,659 | 6,172 | 7,282 | 6,893 | 7,563 | 8,328 | 6,824 | 7,477 | 7,526 | 8,376 |
| 2013 | 8,790 | 7,176 | 6,506 | 7,015 | 7,028 | 5,739 | 7,187 | 6,699 | 6,673 | 6,601 | 7,108 | 7,928 |
| 2014 | 9,294 | 7,645 | 7,459 | 8,264 | 5,308 | 6,480 | 7,257 | 7,102 | 6,713 | 5,752 | 6,628 | 7,963 |
| 2015 | 9,565 | 9,167 | 9,183 | 5,631 | 7,399 | 7,608 | 8,236 | 8,366 | 4,847 | 6,244 | 7,621 | 6,913 |
| 2016 | 8,480 | 7,873 | 8,439 | 6,136 | 6,982 | 5,963 | 7,004 | 6,779 | 5,803 | 5,136 | 6,361 | 8,477 |
| 2017 | 8,249 | 7,099 | 8,515 | 8,279 | 5,421 | 5,289 | 7,030 | 6,672 | 6,745 | 7,466 | 8,536 | 9,933 |
| 2018 | 9,985 | 7,863 | 8,799 | 7,600 | 5,711 | 6,456 | 8,101 | 9,106 | 8,324 | 9,207 | 8,815 | 9,466 |
| 2019 | 9,646 | 7,960 | 8,870 | 6,915 | 6,194 | 5,590 | 8,013 | 8,389 | 5,919 | 7,823 | 8,770 | 8,683 |
| 2020 | 9,175 | 9,078 | 8,292 | 7,935 | 6,206 | 7,559 | 7,899 | 7,699 | 7,515 | 5,918 | 9,070 | 9,618 |
| 2021 | 9,939 | 8,294 | 8,427 | 6,727 | 6,146 | 7,681 | 8,083 | 8,608 | 7,773 | 9,456 | 9,414 | 9,746 |
| 2022 | 10,531 | 8,935 | 8,991 | 6,279 | 5,953 | 6,028 | 7,733 | 7,253 | 5,618 | 6,193 | 8,134 | 6,490 |
| 2023 | 9,391 | 8,607 | 9,649 | 8,638 | 8,243 | 9,008 | 9,123 | 8,678 | 8,713 | 8,404 | 9,801 | 8,158 |
| 2024 | 10,321 | 8,467 | 8,639 | 6,844 | 7,532 | 7,951 | 9,780 | 8,633 | 7,451 | 8,517 | 9,124 | 8,055 |
| 2025 | 11,646 | 9,931 | 8,575 | 7,794 | 7,191 | 7,528 | 9,173 | 8,778 | 7,855 | NA | 10,240 | 12,014 |
| 2026 | 12,160 | NA | 9,187 | 6,573 | ||||||||
| - = No Data Reported; -- = Not Applicable; NA = Not Available; W = Withheld to avoid disclosure of individual company data. |
| Release Date: 6/30/2026 |
| Next Release Date: 7/31/2026 |