|
Download Data (XLS File) |
|
||||||||
|
||||||||
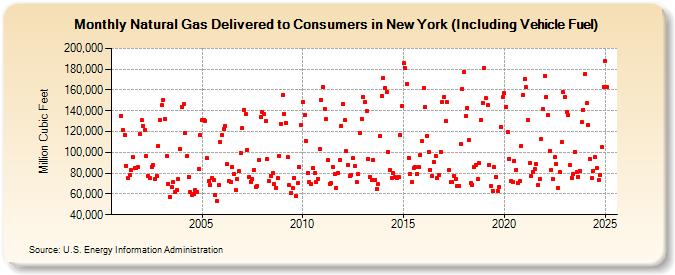
| Natural Gas Delivered to Consumers in New York (Including Vehicle Fuel) (Million Cubic Feet) | ||||||||
| Year | Jan | Feb | Mar | Apr | May | Jun | Jul | Aug | Sep | Oct | Nov | Dec |
|---|---|---|---|---|---|---|---|---|---|---|---|---|
| 2001 | 135,000 | 121,033 | 117,080 | 87,191 | 75,087 | 78,246 | 82,949 | 95,148 | 84,785 | 85,317 | 85,604 | 117,809 |
| 2002 | 130,795 | 125,601 | 121,522 | 96,684 | 77,319 | 74,903 | 86,308 | 87,878 | 74,748 | 77,281 | 106,098 | 130,678 |
| 2003 | 145,176 | 150,464 | 132,321 | 96,357 | 69,848 | 57,468 | 66,369 | 71,177 | 61,893 | 63,566 | 74,370 | 103,175 |
| 2004 | 143,310 | 146,400 | 118,918 | 96,553 | 76,708 | 61,518 | 59,080 | 60,352 | 63,530 | 61,753 | 84,337 | 116,290 |
| 2005 | 131,102 | 130,863 | 130,581 | 94,151 | 72,115 | 68,850 | 75,042 | 73,408 | 58,655 | 53,370 | 68,534 | 109,966 |
| 2006 | 117,077 | 122,348 | 125,713 | 88,492 | 72,223 | 71,803 | 85,597 | 79,345 | 63,354 | 74,825 | 81,800 | 99,716 |
| 2007 | 123,033 | 141,204 | 137,001 | 102,645 | 76,067 | 71,823 | 74,597 | 83,048 | 66,970 | 67,841 | 92,753 | 133,841 |
| 2008 | 139,090 | 137,094 | 130,309 | 93,146 | 72,196 | 77,366 | 80,229 | 69,371 | 65,871 | 75,141 | 96,486 | 127,399 |
| 2009 | 155,189 | 136,711 | 128,423 | 95,282 | 68,148 | 61,211 | 65,798 | 75,578 | 57,719 | 70,093 | 85,796 | 126,202 |
| 2010 | 148,693 | 135,979 | 111,075 | 80,295 | 71,550 | 70,004 | 84,749 | 79,660 | 71,635 | 74,421 | 103,611 | 150,759 |
| 2011 | 163,122 | 141,905 | 131,789 | 92,260 | 69,661 | 70,277 | 85,823 | 78,955 | 65,797 | 79,903 | 92,900 | 125,599 |
| 2012 | 146,859 | 130,730 | 101,027 | 88,046 | 77,143 | 78,668 | 94,426 | 86,454 | 71,617 | 79,128 | 118,786 | 132,120 |
| 2013 | 153,414 | 148,404 | 139,631 | 93,833 | 76,758 | 73,316 | 92,722 | 73,825 | 64,927 | 69,604 | 115,495 | 154,142 |
| 2014 | 171,572 | 162,047 | 158,384 | 100,389 | 82,722 | 75,655 | 80,454 | 76,195 | 74,935 | 76,064 | 116,473 | 144,317 |
| 2015 | 185,541 | 180,721 | 165,966 | 94,938 | 79,062 | 71,536 | 84,611 | 85,551 | 79,377 | 85,801 | 97,650 | 110,651 |
| 2016 | 162,191 | 143,852 | 115,411 | 100,622 | 83,430 | 77,027 | 90,974 | 96,419 | 75,139 | 77,822 | 100,694 | 148,559 |
| 2017 | 153,325 | 130,148 | 148,123 | 82,942 | 71,116 | 71,055 | 77,339 | 74,083 | 67,680 | 67,677 | 107,803 | 160,948 |
| 2018 | 177,724 | 134,842 | 143,131 | 112,274 | 70,343 | 69,044 | 85,895 | 87,870 | 74,016 | 89,402 | 131,442 | 147,807 |
| 2019 | 180,750 | 151,919 | 145,130 | 87,971 | 67,986 | 63,217 | 85,836 | 76,655 | 62,731 | 66,694 | 124,461 | 152,911 |
| 2020 | 156,760 | 143,724 | 119,396 | 93,808 | 72,658 | 71,456 | 92,023 | 82,962 | 70,397 | 72,074 | 106,137 | 155,346 |
| 2021 | 170,335 | 162,601 | 130,778 | 89,675 | 77,250 | 81,297 | 84,198 | 88,564 | 68,150 | 74,137 | 113,306 | 141,280 |
| 2022 | 173,512 | 153,334 | 136,122 | 101,718 | 83,495 | 73,907 | 95,186 | 89,062 | 66,004 | 80,769 | 109,862 | 157,574 |
| 2023 | 152,675 | 138,259 | 135,786 | 86,241 | 73,387 | 77,099 | 99,994 | 79,549 | 76,968 | 80,656 | 126,739 | 139,903 |
| 2024 | 172,203 | 143,932 | 123,629 | 91,566 | 73,931 | 82,857 | 94,819 | 83,085 | 71,468 | 76,745 | 101,957 | 162,425 |
| 2025 | 186,447 | 161,827 | 123,587 | 92,494 | 73,579 | 82,245 | 99,134 | 79,099 | 68,949 | 83,014 | 124,282 | 180,965 |
| 2026 | 197,284 | 166,897 | 136,548 | 98,607 | ||||||||
| - = No Data Reported; -- = Not Applicable; NA = Not Available; W = Withheld to avoid disclosure of individual company data. |
| Release Date: 6/30/2026 |
| Next Release Date: 7/31/2026 |