|
Download Data (XLS File) |
|
||||||||
|
||||||||
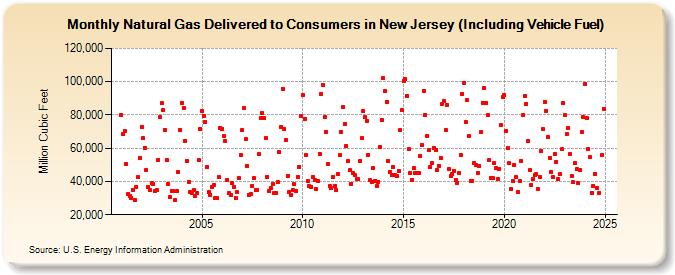
| Natural Gas Delivered to Consumers in New Jersey (Including Vehicle Fuel) (Million Cubic Feet) | ||||||||
| Year | Jan | Feb | Mar | Apr | May | Jun | Jul | Aug | Sep | Oct | Nov | Dec |
|---|---|---|---|---|---|---|---|---|---|---|---|---|
| 2001 | 79,986 | 68,763 | 70,125 | 50,543 | 32,523 | 31,342 | 30,182 | 34,881 | 28,906 | 36,822 | 42,533 | 54,282 |
| 2002 | 72,928 | 65,857 | 60,240 | 47,158 | 36,702 | 34,685 | 39,001 | 38,755 | 34,515 | 35,116 | 53,058 | 78,844 |
| 2003 | 86,899 | 82,946 | 70,961 | 52,763 | 38,335 | 30,506 | 34,444 | 34,047 | 29,057 | 34,046 | 45,854 | 71,131 |
| 2004 | 87,227 | 84,410 | 64,483 | 52,496 | 39,871 | 33,708 | 33,345 | 34,799 | 31,379 | 32,916 | 52,729 | 71,562 |
| 2005 | 82,164 | 79,445 | 75,959 | 48,550 | 33,360 | 32,116 | 36,629 | 37,974 | 30,011 | 29,763 | 42,561 | 72,346 |
| 2006 | 71,490 | 67,063 | 64,461 | 41,052 | 32,890 | 32,020 | 38,801 | 36,943 | 30,076 | 33,548 | 41,819 | 55,840 |
| 2007 | 70,759 | 83,985 | 65,491 | 49,411 | 31,902 | 32,534 | 37,336 | 41,864 | 34,665 | 34,754 | 56,211 | 78,367 |
| 2008 | 81,016 | 77,952 | 66,150 | 42,927 | 34,010 | 35,898 | 38,518 | 33,176 | 33,124 | 39,578 | 57,828 | 72,663 |
| 2009 | 95,602 | 71,552 | 64,810 | 43,447 | 33,689 | 31,720 | 34,562 | 38,186 | 34,157 | 42,914 | 48,986 | 79,348 |
| 2010 | 91,877 | 77,620 | 56,188 | 40,057 | 37,226 | 36,955 | 42,902 | 40,760 | 35,585 | 40,371 | 56,766 | 92,792 |
| 2011 | 97,844 | 78,662 | 70,028 | 50,398 | 37,170 | 36,210 | 42,629 | 37,312 | 34,901 | 44,348 | 55,605 | 69,980 |
| 2012 | 84,790 | 74,625 | 61,194 | 52,080 | 46,657 | 38,688 | 44,789 | 43,857 | 41,320 | 41,269 | 52,262 | 65,927 |
| 2013 | 82,095 | 78,574 | 76,453 | 56,151 | 40,659 | 39,439 | 47,810 | 40,515 | 37,225 | 39,932 | 60,659 | 77,175 |
| 2014 | 102,052 | 94,211 | 87,759 | 52,255 | 45,820 | 43,606 | 48,824 | 43,696 | 43,077 | 46,040 | 70,897 | 83,091 |
| 2015 | 100,401 | 101,480 | 91,613 | 59,283 | 44,959 | 41,009 | 47,893 | 45,019 | 45,046 | 45,099 | 55,589 | 62,020 |
| 2016 | 94,640 | 80,050 | 67,513 | 58,705 | 48,812 | 50,907 | 60,273 | 58,902 | 46,989 | 49,463 | 54,218 | 86,360 |
| 2017 | 88,204 | 70,987 | 86,195 | 47,253 | 43,254 | 44,358 | 46,435 | 40,980 | 39,322 | 45,173 | 55,931 | 92,817 |
| 2018 | 99,365 | 75,957 | 88,816 | 67,385 | 40,388 | 40,505 | 51,045 | 49,844 | 45,130 | 49,491 | 69,445 | 87,450 |
| 2019 | 96,187 | 87,243 | 79,718 | 52,742 | 42,274 | 42,008 | 50,851 | 47,933 | 41,416 | 47,526 | 73,935 | 90,505 |
| 2020 | 91,809 | 70,114 | 59,820 | 51,053 | 35,486 | 40,311 | 49,924 | 42,459 | 33,698 | 39,971 | 52,334 | 79,659 |
| 2021 | 91,315 | 86,804 | 64,058 | 46,669 | 37,755 | 41,455 | 43,876 | 44,248 | 35,609 | 42,537 | 58,373 | 71,393 |
| 2022 | 88,046 | 82,419 | 66,791 | 54,231 | 45,974 | 42,376 | 56,219 | 51,901 | 41,249 | 44,320 | 59,210 | 87,270 |
| 2023 | 79,237 | 68,083 | 71,910 | 56,980 | 42,581 | 38,446 | 51,619 | 46,764 | 38,209 | 47,174 | 69,488 | 77,847 |
| 2024 | 95,151 | 77,986 | 59,326 | 54,654 | 33,148 | 37,433 | 44,519 | 35,819 | 32,083 | 39,544 | 56,050 | 83,103 |
| 2025 | NA | NA | NA | 59,515 | NA | NA | NA | NA | 33,320 | NA | 63,475 | 93,940 |
| 2026 | 100,533 | 101,704 | 66,198 | |||||||||
| - = No Data Reported; -- = Not Applicable; NA = Not Available; W = Withheld to avoid disclosure of individual company data. |
| Release Date: 5/29/2026 |
| Next Release Date: 6/30/2026 |