|
Download Data (XLS File) |
|
||||||||
|
||||||||
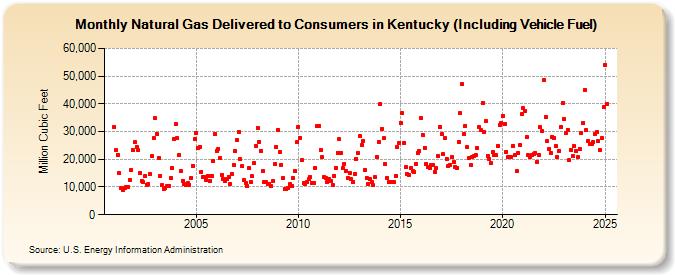
| Natural Gas Delivered to Consumers in Kentucky (Including Vehicle Fuel) (Million Cubic Feet) | ||||||||
| Year | Jan | Feb | Mar | Apr | May | Jun | Jul | Aug | Sep | Oct | Nov | Dec |
|---|---|---|---|---|---|---|---|---|---|---|---|---|
| 2001 | 31,659 | 23,182 | 21,670 | 14,953 | 9,527 | 8,890 | 9,668 | 9,881 | 10,024 | 12,591 | 16,271 | 23,216 |
| 2002 | 26,131 | 24,533 | 23,241 | 14,879 | 12,317 | 11,623 | 13,804 | 10,869 | 11,129 | 14,628 | 21,069 | 27,646 |
| 2003 | 34,776 | 29,032 | 20,580 | 14,017 | 10,797 | 9,334 | 9,467 | 10,296 | 10,390 | 13,196 | 16,933 | 27,218 |
| 2004 | 32,640 | 27,566 | 21,630 | 15,771 | 12,331 | 11,249 | 10,810 | 11,428 | 10,883 | 13,355 | 17,689 | 27,203 |
| 2005 | 29,373 | 24,036 | 24,578 | 15,557 | 13,614 | 13,693 | 12,658 | 14,134 | 12,122 | 14,104 | 19,304 | 29,050 |
| 2006 | 23,093 | 23,721 | 20,380 | 14,447 | 13,054 | 12,108 | 12,861 | 13,777 | 11,131 | 14,865 | 17,982 | 22,930 |
| 2007 | 26,916 | 29,946 | 20,044 | 17,410 | 12,573 | 11,418 | 10,304 | 16,709 | 11,848 | 13,874 | 18,696 | 24,799 |
| 2008 | 31,371 | 26,407 | 23,120 | 15,637 | 11,942 | 11,764 | 11,231 | 11,210 | 10,321 | 12,133 | 18,142 | 24,552 |
| 2009 | 30,552 | 22,499 | 18,099 | 13,105 | 9,320 | 9,225 | 9,738 | 10,909 | 10,373 | 13,346 | 15,756 | 26,099 |
| 2010 | 31,801 | 27,772 | 19,615 | 11,362 | 11,218 | 11,723 | 12,797 | 13,651 | 11,493 | 11,545 | 17,031 | 31,985 |
| 2011 | 32,180 | 23,501 | 20,670 | 13,694 | 13,343 | 11,895 | 12,715 | 12,210 | 10,817 | 14,066 | 16,856 | 22,433 |
| 2012 | 27,136 | 22,392 | 16,750 | 18,386 | 15,760 | 13,392 | 15,130 | 12,721 | 11,849 | 14,695 | 20,026 | 22,347 |
| 2013 | 28,296 | 25,046 | 26,516 | 16,151 | 13,274 | 11,104 | 12,729 | 11,900 | 10,628 | 13,515 | 20,972 | 26,319 |
| 2014 | 39,777 | 31,059 | 27,558 | 18,126 | 13,279 | 11,819 | 11,875 | 11,658 | 11,657 | 14,020 | 24,307 | 25,903 |
| 2015 | 33,156 | 36,558 | 25,999 | 17,071 | 14,583 | 14,264 | 16,776 | 15,667 | 15,439 | 18,414 | 22,360 | 22,930 |
| 2016 | 34,717 | 28,590 | 24,222 | 18,359 | 17,148 | 16,774 | 17,860 | 17,924 | 15,565 | 16,707 | 21,120 | 31,721 |
| 2017 | 29,095 | 21,757 | 27,536 | 20,204 | 17,574 | 17,948 | 20,685 | 18,968 | 17,332 | 16,866 | 26,328 | 36,591 |
| 2018 | 47,093 | 29,194 | 32,066 | 24,354 | 20,359 | 17,786 | 20,967 | 21,141 | 21,388 | 23,988 | 31,680 | 30,621 |
| 2019 | 40,381 | 29,735 | 33,849 | 21,306 | 20,110 | 18,729 | 22,511 | 21,676 | 21,567 | 24,964 | 32,345 | 33,099 |
| 2020 | 35,637 | 32,758 | 22,730 | 20,934 | 20,892 | 20,869 | 24,888 | 21,499 | 15,733 | 22,217 | 25,095 | 36,280 |
| 2021 | 38,319 | 37,486 | 28,061 | 21,403 | 20,983 | 21,452 | 21,963 | 22,358 | 19,081 | 21,595 | 31,500 | 30,047 |
| 2022 | 48,621 | 35,196 | 26,470 | 23,707 | 22,308 | 28,081 | 27,821 | 24,855 | 20,759 | 23,160 | 31,734 | 40,231 |
| 2023 | 34,758 | 30,185 | 31,712 | 19,276 | 23,213 | 21,138 | 24,572 | 23,232 | 20,519 | 23,728 | 29,611 | 34,129 |
| 2024 | 45,154 | 30,658 | 26,845 | 25,554 | 26,077 | 25,999 | 28,961 | 29,551 | 25,710 | 22,097 | 26,621 | 38,519 |
| 2025 | 54,132 | 39,779 | 27,963 | 24,572 | 23,493 | 25,962 | 32,651 | NA | 24,167 | 24,316 | 31,607 | 43,151 |
| 2026 | 51,518 | 38,158 | 26,820 | 25,788 | ||||||||
| - = No Data Reported; -- = Not Applicable; NA = Not Available; W = Withheld to avoid disclosure of individual company data. |
| Release Date: 6/30/2026 |
| Next Release Date: 7/31/2026 |