|
Download Data (XLS File) |
|
||||||||
|
||||||||
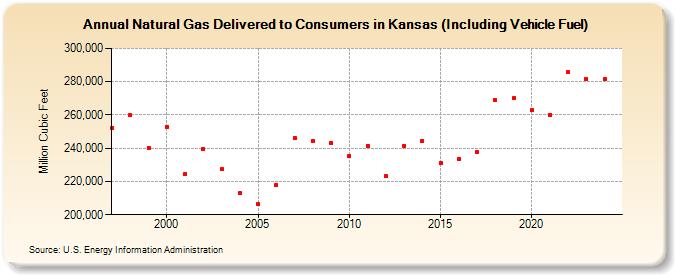
| Natural Gas Delivered to Consumers in Kansas (Including Vehicle Fuel) (Million Cubic Feet) | ||||||||
| Decade | Year-0 | Year-1 | Year-2 | Year-3 | Year-4 | Year-5 | Year-6 | Year-7 | Year-8 | Year-9 |
|---|---|---|---|---|---|---|---|---|---|---|
| 1990's | 252,275 | 259,783 | 240,248 | |||||||
| 2000's | 253,037 | 224,367 | 239,449 | 227,436 | 213,122 | 206,537 | 217,981 | 246,094 | 244,181 | 243,199 |
| 2010's | 235,316 | 241,473 | 223,188 | 241,292 | 244,318 | 231,220 | 233,473 | 237,781 | 268,842 | 269,994 |
| 2020's | 262,979 | 260,252 | 285,582 | 278,427 | 281,788 | 270,581 |
| - = No Data Reported; -- = Not Applicable; NA = Not Available; W = Withheld to avoid disclosure of individual company data. |
| Release Date: 6/30/2026 |
| Next Release Date: 7/31/2026 |