|
Download Data (XLS File) |
|
||||||||
|
||||||||
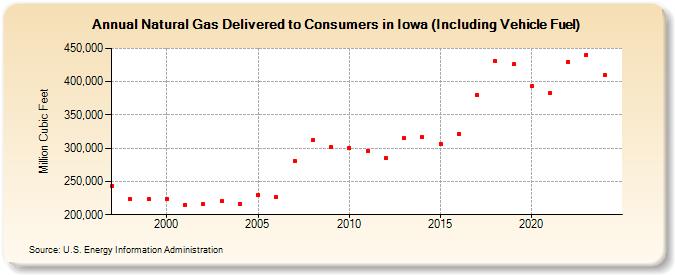
| Natural Gas Delivered to Consumers in Iowa (Including Vehicle Fuel) (Million Cubic Feet) | ||||||||
| Decade | Year-0 | Year-1 | Year-2 | Year-3 | Year-4 | Year-5 | Year-6 | Year-7 | Year-8 | Year-9 |
|---|---|---|---|---|---|---|---|---|---|---|
| 1990's | 243,181 | 223,287 | 222,943 | |||||||
| 2000's | 224,299 | 215,348 | 215,482 | 220,263 | 216,625 | 229,717 | 225,929 | 280,954 | 311,672 | 301,340 |
| 2010's | 300,033 | 296,098 | 285,038 | 314,742 | 316,676 | 306,899 | 321,194 | 380,666 | 430,947 | 426,109 |
| 2020's | 393,253 | 382,890 | 430,035 | 433,651 | 424,175 | NA |
| - = No Data Reported; -- = Not Applicable; NA = Not Available; W = Withheld to avoid disclosure of individual company data. |
| Release Date: 6/30/2026 |
| Next Release Date: 7/31/2026 |