|
Download Data (XLS File) |
|
||||||||
|
||||||||
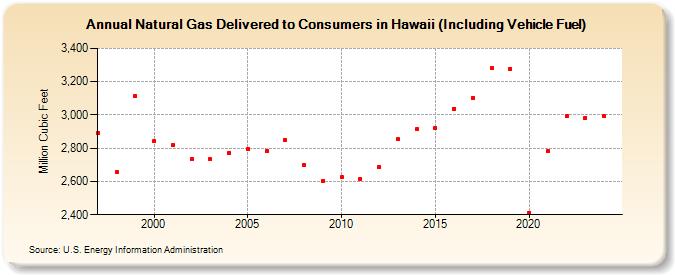
| Natural Gas Delivered to Consumers in Hawaii (Including Vehicle Fuel) (Million Cubic Feet) | ||||||||
| Decade | Year-0 | Year-1 | Year-2 | Year-3 | Year-4 | Year-5 | Year-6 | Year-7 | Year-8 | Year-9 |
|---|---|---|---|---|---|---|---|---|---|---|
| 1990's | 2,894 | 2,654 | 3,115 | |||||||
| 2000's | 2,841 | 2,818 | 2,734 | 2,732 | 2,772 | 2,793 | 2,782 | 2,848 | 2,700 | 2,605 |
| 2010's | 2,625 | 2,616 | 2,687 | 2,853 | 2,915 | 2,922 | 3,038 | 3,104 | 3,280 | 3,277 |
| 2020's | 2,412 | 2,781 | 2,993 | 2,983 | 2,994 | 2,891 |
| - = No Data Reported; -- = Not Applicable; NA = Not Available; W = Withheld to avoid disclosure of individual company data. |
| Release Date: 6/30/2026 |
| Next Release Date: 7/31/2026 |