|
Download Data (XLS File) |
|
||||||||
|
||||||||
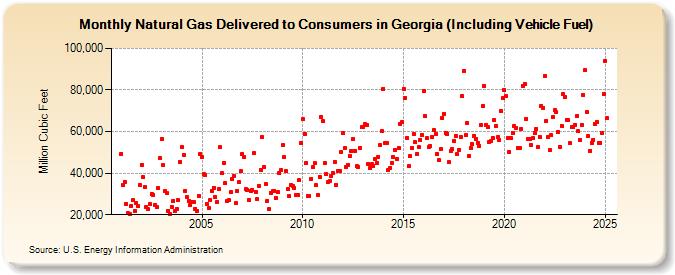
| Natural Gas Delivered to Consumers in Georgia (Including Vehicle Fuel) (Million Cubic Feet) | ||||||||
| Year | Jan | Feb | Mar | Apr | May | Jun | Jul | Aug | Sep | Oct | Nov | Dec |
|---|---|---|---|---|---|---|---|---|---|---|---|---|
| 2001 | 49,414 | 34,292 | 35,867 | 25,368 | 20,633 | 20,544 | 24,229 | 26,863 | 21,857 | 25,679 | 23,983 | 34,450 |
| 2002 | 44,041 | 37,992 | 33,260 | 23,775 | 22,612 | 24,924 | 30,113 | 29,701 | 24,899 | 23,785 | 32,829 | 47,106 |
| 2003 | 56,470 | 43,704 | 31,355 | 30,232 | 21,920 | 20,512 | 23,789 | 26,828 | 21,628 | 22,981 | 26,920 | 45,508 |
| 2004 | 52,486 | 48,806 | 31,529 | 28,718 | 26,610 | 24,562 | 26,132 | 26,093 | 22,927 | 22,025 | 29,012 | 49,125 |
| 2005 | 47,756 | 39,503 | 39,085 | 25,191 | 23,198 | 26,957 | 31,619 | 33,089 | 28,453 | 26,199 | 32,483 | 52,399 |
| 2006 | 39,904 | 45,015 | 35,118 | 26,670 | 26,891 | 30,790 | 36,980 | 38,808 | 25,412 | 31,321 | 35,677 | 40,816 |
| 2007 | 49,163 | 47,589 | 32,236 | 31,955 | 27,318 | 31,415 | 32,039 | 49,457 | 31,028 | 27,420 | 33,851 | 41,413 |
| 2008 | 57,281 | 42,777 | 34,804 | 26,663 | 22,574 | 30,576 | 31,233 | 31,449 | 28,207 | 30,900 | 40,166 | 41,352 |
| 2009 | 53,365 | 47,708 | 40,809 | 32,388 | 28,948 | 34,499 | 33,996 | 32,876 | 29,455 | 29,641 | 36,652 | 54,673 |
| 2010 | 65,896 | 58,795 | 44,827 | 28,789 | 29,136 | 37,413 | 42,833 | 44,765 | 34,160 | 29,516 | 38,358 | 67,069 |
| 2011 | 65,024 | 44,959 | 39,594 | 35,529 | 36,053 | 38,548 | 40,138 | 45,552 | 34,486 | 41,205 | 41,251 | 50,126 |
| 2012 | 59,090 | 52,079 | 43,088 | 43,920 | 48,474 | 50,740 | 56,474 | 50,864 | 43,263 | 43,020 | 52,299 | 61,950 |
| 2013 | 62,324 | 63,455 | 63,195 | 44,422 | 42,239 | 44,390 | 43,617 | 46,916 | 44,920 | 47,927 | 53,651 | 60,252 |
| 2014 | 80,653 | 54,609 | 54,667 | 41,700 | 42,666 | 45,029 | 47,671 | 51,275 | 47,009 | 51,911 | 63,798 | 64,442 |
| 2015 | 80,644 | 76,170 | 57,083 | 43,196 | 48,174 | 52,162 | 58,833 | 54,749 | 49,225 | 52,525 | 55,942 | 58,304 |
| 2016 | 79,477 | 67,243 | 56,885 | 52,685 | 53,101 | 57,356 | 60,677 | 59,034 | 49,244 | 46,157 | 51,394 | 66,524 |
| 2017 | 68,612 | 59,497 | 58,895 | 45,222 | 50,663 | 51,547 | 55,516 | 57,875 | 49,061 | 51,308 | 57,430 | 77,082 |
| 2018 | 89,206 | 58,135 | 64,326 | 48,362 | 52,159 | 53,793 | 58,016 | 56,339 | 54,730 | 53,277 | 63,172 | 72,230 |
| 2019 | 81,967 | 63,219 | 61,951 | 54,864 | 55,282 | 56,951 | 65,576 | 62,726 | 57,394 | 56,021 | 69,796 | 75,963 |
| 2020 | 79,876 | 76,959 | 56,669 | 50,255 | 56,719 | 59,310 | 62,602 | 61,828 | 52,014 | 52,101 | 61,448 | 82,089 |
| 2021 | 82,877 | 66,158 | 56,254 | 56,317 | 53,520 | 56,826 | 59,523 | 61,399 | 52,649 | 57,555 | 72,311 | 71,431 |
| 2022 | 86,674 | 65,290 | 57,600 | 51,092 | 58,191 | 67,047 | 70,355 | 69,179 | 59,816 | 52,693 | 62,907 | 77,955 |
| 2023 | 75,630 | 64,429 | 64,352 | 54,070 | 60,345 | 61,499 | 63,925 | 65,781 | 58,727 | 52,777 | 60,271 | 77,080 |
| 2024 | 88,843 | 68,279 | 55,439 | 49,748 | 53,324 | 55,619 | 64,937 | 65,310 | 55,466 | 54,872 | 58,886 | 78,583 |
| 2025 | 94,305 | 65,576 | 58,997 | 50,217 | 55,827 | 55,247 | 63,740 | 60,356 | 55,076 | 56,874 | 61,907 | 76,948 |
| 2026 | 84,266 | 67,857 | 58,265 | 49,814 | ||||||||
| - = No Data Reported; -- = Not Applicable; NA = Not Available; W = Withheld to avoid disclosure of individual company data. |
| Release Date: 6/30/2026 |
| Next Release Date: 7/31/2026 |