|
Download Data (XLS File) |
|
||||||||
|
||||||||
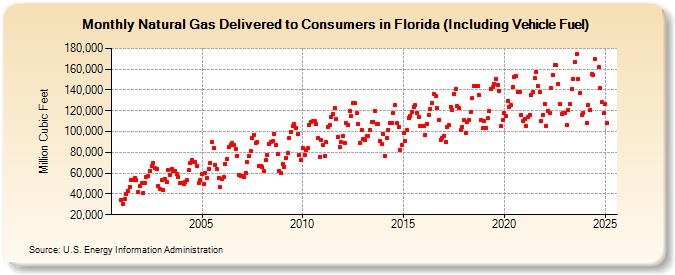
| Natural Gas Delivered to Consumers in Florida (Including Vehicle Fuel) (Million Cubic Feet) | ||||||||
| Year | Jan | Feb | Mar | Apr | May | Jun | Jul | Aug | Sep | Oct | Nov | Dec |
|---|---|---|---|---|---|---|---|---|---|---|---|---|
| 2001 | 34,086 | 30,338 | 35,463 | 39,708 | 42,466 | 46,947 | 53,430 | 53,352 | 55,306 | 52,955 | 42,205 | 47,598 |
| 2002 | 50,177 | 41,302 | 50,453 | 55,845 | 56,767 | 62,343 | 67,197 | 70,144 | 65,136 | 64,259 | 47,600 | 45,144 |
| 2003 | 53,384 | 43,538 | 54,761 | 51,487 | 62,575 | 58,312 | 64,041 | 61,764 | 62,150 | 59,558 | 56,488 | 50,525 |
| 2004 | 50,877 | 49,866 | 51,687 | 53,442 | 62,663 | 69,628 | 72,443 | 70,540 | 70,259 | 66,961 | 50,122 | 53,169 |
| 2005 | 59,417 | 49,956 | 60,238 | 55,269 | 64,436 | 69,719 | 90,376 | 84,114 | 67,877 | 63,782 | 55,683 | 46,489 |
| 2006 | 54,827 | 56,557 | 68,707 | 73,645 | 85,346 | 87,268 | 88,949 | 86,772 | 83,397 | 76,817 | 58,594 | 56,867 |
| 2007 | 57,409 | 56,412 | 60,397 | 70,366 | 76,461 | 81,312 | 93,683 | 97,040 | 88,865 | 89,976 | 66,512 | 67,153 |
| 2008 | 65,840 | 62,468 | 72,413 | 77,114 | 87,640 | 90,358 | 90,655 | 97,760 | 87,018 | 78,114 | 62,402 | 60,253 |
| 2009 | 68,323 | 66,370 | 74,153 | 79,386 | 93,665 | 99,987 | 105,117 | 107,054 | 103,511 | 97,534 | 77,426 | 72,233 |
| 2010 | 84,227 | 77,168 | 82,297 | 83,887 | 105,947 | 109,301 | 110,010 | 110,242 | 106,798 | 93,504 | 75,933 | 91,828 |
| 2011 | 86,848 | 76,548 | 89,696 | 104,650 | 106,441 | 113,966 | 117,227 | 122,207 | 111,766 | 94,736 | 85,584 | 89,579 |
| 2012 | 95,926 | 89,361 | 107,851 | 106,343 | 120,137 | 115,163 | 127,404 | 127,290 | 118,031 | 107,208 | 89,336 | 101,973 |
| 2013 | 92,797 | 91,718 | 95,673 | 95,326 | 101,092 | 109,284 | 109,648 | 119,374 | 107,449 | 106,787 | 90,632 | 87,792 |
| 2014 | 97,386 | 76,417 | 94,126 | 101,757 | 107,879 | 107,969 | 117,412 | 125,105 | 108,448 | 104,194 | 82,652 | 87,443 |
| 2015 | 98,429 | 90,983 | 101,420 | 112,873 | 114,992 | 118,863 | 123,817 | 125,213 | 117,812 | 113,800 | 105,544 | 104,960 |
| 2016 | 105,732 | 96,617 | 107,347 | 115,483 | 121,474 | 127,361 | 136,095 | 134,141 | 122,388 | 111,434 | 92,004 | 93,522 |
| 2017 | 96,142 | 89,494 | 104,327 | 106,054 | 123,676 | 120,873 | 136,438 | 140,857 | 124,175 | 122,406 | 101,363 | 104,469 |
| 2018 | 110,801 | 98,331 | 109,094 | 111,251 | 118,789 | 132,053 | 143,663 | 143,541 | 143,684 | 134,703 | 110,974 | 103,208 |
| 2019 | 109,672 | 103,110 | 112,890 | 119,510 | 141,238 | 142,458 | 146,165 | 150,091 | 145,085 | 139,297 | 105,021 | 111,220 |
| 2020 | 117,489 | 115,175 | 129,548 | 123,870 | 125,361 | 142,420 | 152,276 | 153,571 | 138,354 | 138,075 | 116,002 | 109,824 |
| 2021 | 111,798 | 105,130 | 113,941 | 116,367 | 134,914 | 137,734 | 151,178 | 157,558 | 143,667 | 137,954 | 110,625 | 115,658 |
| 2022 | 126,948 | 105,451 | 120,020 | 117,942 | 141,713 | 154,365 | 164,349 | 163,640 | 146,091 | 126,736 | 116,756 | 117,605 |
| 2023 | 117,245 | 105,377 | 123,378 | 127,599 | 140,212 | 148,682 | 165,000 | 171,891 | 149,067 | 136,379 | 115,782 | 117,252 |
| 2024 | 125,697 | 109,413 | 126,358 | 120,671 | 156,578 | 154,485 | 169,375 | 167,474 | 161,358 | 140,597 | 127,848 | 117,311 |
| 2025 | 126,855 | 108,030 | 115,781 | 119,954 | 146,869 | 152,807 | 167,896 | 167,115 | 148,420 | 137,944 | 111,056 | 116,713 |
| 2026 | 123,481 | NA | 121,635 | NA | ||||||||
| - = No Data Reported; -- = Not Applicable; NA = Not Available; W = Withheld to avoid disclosure of individual company data. |
| Release Date: 6/30/2026 |
| Next Release Date: 7/31/2026 |