|
Download Data (XLS File) |
|
||||||||
|
||||||||
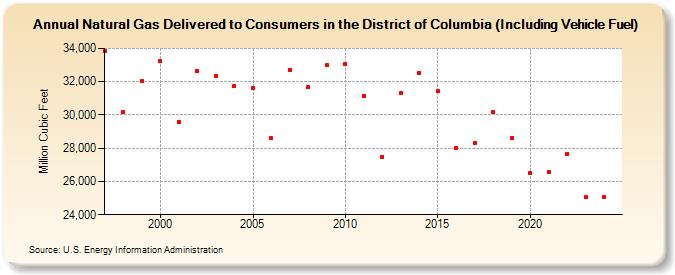
| Natural Gas Delivered to Consumers in the District of Columbia (Including Vehicle Fuel) (Million Cubic Feet) | ||||||||
| Decade | Year-0 | Year-1 | Year-2 | Year-3 | Year-4 | Year-5 | Year-6 | Year-7 | Year-8 | Year-9 |
|---|---|---|---|---|---|---|---|---|---|---|
| 1990's | 33,860 | 30,153 | 32,037 | |||||||
| 2000's | 33,225 | 29,567 | 32,656 | 32,345 | 31,762 | 31,598 | 28,585 | 32,728 | 31,678 | 33,000 |
| 2010's | 33,038 | 31,159 | 27,493 | 31,309 | 32,543 | 31,419 | 27,987 | 28,331 | 30,172 | 28,636 |
| 2020's | 26,529 | 26,555 | 27,663 | 25,045 | 24,835 | 27,281 |
| - = No Data Reported; -- = Not Applicable; NA = Not Available; W = Withheld to avoid disclosure of individual company data. |
| Release Date: 6/30/2026 |
| Next Release Date: 7/31/2026 |