|
Download Data (XLS File) |
|
||||||||
|
||||||||
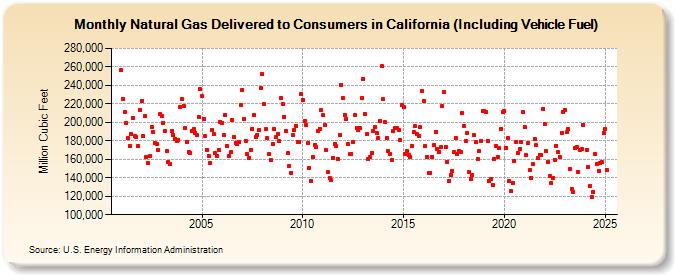
| Natural Gas Delivered to Consumers in California (Including Vehicle Fuel) (Million Cubic Feet) | ||||||||
| Year | Jan | Feb | Mar | Apr | May | Jun | Jul | Aug | Sep | Oct | Nov | Dec |
|---|---|---|---|---|---|---|---|---|---|---|---|---|
| 2001 | 256,236 | 225,525 | 210,711 | 198,804 | 182,600 | 174,840 | 186,844 | 204,883 | 185,162 | 184,119 | 174,839 | 213,717 |
| 2002 | 223,346 | 185,421 | 206,416 | 162,875 | 156,501 | 163,505 | 194,816 | 189,345 | 177,933 | 177,028 | 170,370 | 208,568 |
| 2003 | 206,909 | 199,691 | 190,785 | 169,036 | 156,895 | 155,289 | 190,664 | 186,767 | 182,143 | 179,341 | 181,360 | 216,415 |
| 2004 | 225,305 | 217,935 | 193,344 | 178,944 | 167,463 | 166,916 | 190,886 | 192,642 | 188,814 | 186,336 | 205,784 | 235,615 |
| 2005 | 228,279 | 203,927 | 184,829 | 170,521 | 163,918 | 156,344 | 191,687 | 187,213 | 166,515 | 163,308 | 170,177 | 200,612 |
| 2006 | 199,652 | 186,181 | 207,878 | 174,325 | 163,781 | 167,537 | 203,041 | 184,106 | 177,931 | 176,728 | 179,219 | 218,721 |
| 2007 | 235,318 | 203,363 | 180,141 | 165,385 | 161,220 | 170,560 | 193,098 | 207,823 | 183,842 | 186,625 | 192,161 | 236,654 |
| 2008 | 252,256 | 219,719 | 192,366 | 182,504 | 166,188 | 159,240 | 176,823 | 193,075 | 184,155 | 187,051 | 179,314 | 226,118 |
| 2009 | 219,330 | 206,088 | 190,858 | 166,489 | 152,603 | 145,416 | 186,280 | 192,111 | 196,549 | 178,653 | 179,068 | 230,133 |
| 2010 | 224,248 | 201,908 | 196,564 | 177,738 | 151,001 | 136,709 | 162,212 | 175,137 | 172,976 | 191,003 | 193,207 | 213,383 |
| 2011 | 207,654 | 196,577 | 170,209 | 145,853 | 139,240 | 137,075 | 161,447 | 176,413 | 174,263 | 160,500 | 186,403 | 240,645 |
| 2012 | 226,299 | 207,537 | 203,370 | 176,281 | 165,375 | 165,863 | 179,207 | 208,397 | 194,104 | 191,369 | 193,400 | 225,814 |
| 2013 | 246,850 | 209,104 | 187,296 | 159,828 | 162,719 | 167,204 | 190,260 | 195,058 | 188,669 | 183,115 | 201,865 | 260,454 |
| 2014 | 224,852 | 199,902 | 183,038 | 168,620 | 166,204 | 159,661 | 190,351 | 193,331 | 193,409 | 191,905 | 181,273 | 218,289 |
| 2015 | 216,065 | 165,799 | 168,835 | 164,979 | 162,529 | 174,388 | 189,714 | 195,602 | 187,006 | 184,678 | 194,636 | 233,993 |
| 2016 | 223,373 | 174,197 | 162,754 | 144,618 | 145,157 | 162,945 | 175,135 | 189,633 | 171,347 | 168,407 | 173,278 | 217,558 |
| 2017 | 232,305 | 173,392 | 157,399 | 136,967 | 143,180 | 147,222 | 167,736 | 183,337 | 166,203 | 168,754 | 168,321 | 210,260 |
| 2018 | 196,195 | 180,118 | 188,187 | 145,864 | 138,969 | 143,361 | 185,992 | 178,351 | 160,657 | 168,809 | 179,877 | 211,736 |
| 2019 | 211,960 | 210,904 | 179,996 | 136,590 | 138,811 | 131,992 | 160,404 | 174,664 | 162,908 | 172,150 | 192,479 | 210,751 |
| 2020 | 212,211 | 172,586 | 182,773 | 136,500 | 125,295 | 134,540 | 157,949 | 179,174 | 166,985 | 170,666 | 178,428 | 210,847 |
| 2021 | 195,087 | 164,201 | 177,219 | 148,023 | 140,206 | 154,963 | 181,926 | 175,144 | 161,277 | 164,940 | 164,762 | 214,732 |
| 2022 | 197,997 | 168,849 | 156,835 | 141,603 | 134,841 | 140,100 | 159,332 | 174,616 | 167,458 | 162,956 | 188,206 | 211,637 |
| 2023 | 213,514 | 190,135 | 192,853 | 148,882 | 127,006 | 124,697 | 171,388 | 172,994 | 146,597 | 169,957 | 170,236 | 196,932 |
| 2024 | 206,227 | 172,076 | 153,341 | 131,378 | 120,850 | 126,030 | 167,377 | 156,546 | 148,648 | 157,644 | 158,402 | 189,462 |
| 2025 | 193,813 | 148,970 | 148,979 | 126,482 | 118,180 | 123,152 | 134,729 | 156,966 | 145,850 | 137,370 | 154,751 | 166,959 |
| 2026 | 154,505 | 134,340 | 117,773 | NA | ||||||||
| - = No Data Reported; -- = Not Applicable; NA = Not Available; W = Withheld to avoid disclosure of individual company data. |
| Release Date: 6/30/2026 |
| Next Release Date: 7/31/2026 |