|
Download Data (XLS File) |
|
||||||||
|
||||||||
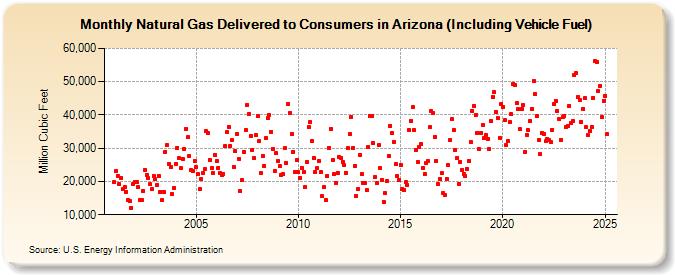
| Natural Gas Delivered to Consumers in Arizona (Including Vehicle Fuel) (Million Cubic Feet) | ||||||||
| Year | Jan | Feb | Mar | Apr | May | Jun | Jul | Aug | Sep | Oct | Nov | Dec |
|---|---|---|---|---|---|---|---|---|---|---|---|---|
| 2001 | 19,804 | 23,088 | 21,742 | 19,153 | 21,113 | 17,703 | 18,312 | 16,919 | 14,352 | 14,127 | 12,164 | 19,204 |
| 2002 | 19,840 | 19,954 | 18,340 | 14,544 | 14,463 | 17,262 | 23,546 | 22,088 | 20,988 | 19,112 | 17,712 | 21,662 |
| 2003 | 20,639 | 18,895 | 21,753 | 16,848 | 14,559 | 16,858 | 28,981 | 30,940 | 25,278 | 24,409 | 16,317 | 18,043 |
| 2004 | 25,379 | 30,143 | 26,925 | 23,982 | 26,878 | 29,819 | 35,860 | 33,244 | 27,591 | 23,349 | 23,090 | 26,140 |
| 2005 | 24,400 | 22,209 | 17,591 | 20,779 | 22,660 | 23,609 | 35,036 | 34,587 | 26,451 | 24,130 | 22,651 | 28,011 |
| 2006 | 26,212 | 24,177 | 22,606 | 21,814 | 22,339 | 30,548 | 34,718 | 36,448 | 30,678 | 32,378 | 24,493 | 29,027 |
| 2007 | 34,237 | 26,857 | 17,051 | 20,379 | 28,959 | 35,463 | 43,104 | 40,305 | 33,790 | 29,544 | 27,001 | 33,835 |
| 2008 | 39,542 | 32,180 | 22,438 | 27,625 | 24,736 | 33,135 | 38,939 | 39,922 | 34,978 | 29,837 | 23,194 | 28,443 |
| 2009 | 26,111 | 24,516 | 22,012 | 22,186 | 29,926 | 25,695 | 43,248 | 40,723 | 34,242 | 28,949 | 22,747 | 26,424 |
| 2010 | 22,766 | 21,073 | 24,108 | 22,800 | 18,249 | 25,949 | 36,376 | 37,833 | 32,306 | 27,058 | 22,974 | 23,956 |
| 2011 | 26,189 | 22,708 | 15,504 | 18,263 | 14,474 | 21,731 | 30,174 | 35,881 | 26,412 | 22,244 | 19,475 | 22,572 |
| 2012 | 27,258 | 27,002 | 25,938 | 24,807 | 22,654 | 30,048 | 34,257 | 39,520 | 30,135 | 24,752 | 15,611 | 17,703 |
| 2013 | 28,047 | 22,210 | 19,446 | 19,477 | 17,328 | 30,469 | 39,622 | 39,704 | 31,545 | 21,328 | 19,460 | 30,814 |
| 2014 | 24,041 | 20,464 | 13,935 | 16,417 | 20,069 | 27,795 | 36,749 | 34,547 | 31,954 | 25,160 | 21,566 | 20,524 |
| 2015 | 25,044 | 17,872 | 17,365 | 19,730 | 18,984 | 35,407 | 38,149 | 42,348 | 35,335 | 29,432 | 25,860 | 30,504 |
| 2016 | 31,130 | 24,125 | 22,214 | 25,567 | 26,217 | 36,228 | 41,072 | 40,604 | 33,491 | 26,285 | 19,219 | 20,711 |
| 2017 | 22,393 | 16,509 | 15,866 | 20,869 | 24,826 | 32,417 | 38,717 | 35,565 | 29,423 | 27,099 | 19,207 | 25,909 |
| 2018 | 23,446 | 22,323 | 21,706 | 23,881 | 26,258 | 31,851 | 41,250 | 42,730 | 39,979 | 34,652 | 29,700 | 34,637 |
| 2019 | 36,995 | 32,949 | 33,949 | 32,855 | 29,782 | 38,144 | 45,416 | 46,755 | 40,971 | 39,189 | 33,056 | 43,265 |
| 2020 | 42,426 | 38,342 | 30,956 | 32,263 | 37,849 | 40,192 | 49,322 | 49,079 | 43,502 | 41,719 | 35,624 | 41,811 |
| 2021 | 42,950 | 28,948 | 34,099 | 35,328 | 38,169 | 41,908 | 50,266 | 46,256 | 39,704 | 32,592 | 28,158 | 34,492 |
| 2022 | 34,163 | 32,018 | 32,852 | 32,383 | 31,763 | 35,605 | 43,273 | 44,229 | 41,206 | 38,654 | 32,589 | 39,280 |
| 2023 | 39,899 | 36,427 | 36,837 | 42,912 | 37,532 | 38,189 | 51,793 | 52,472 | 45,518 | 44,466 | 38,031 | 41,891 |
| 2024 | 44,754 | 36,019 | 33,635 | 34,978 | 36,324 | 45,177 | 55,866 | 55,689 | 47,036 | 48,828 | 39,419 | 44,066 |
| 2025 | 45,723 | 34,184 | 28,404 | 33,455 | 36,932 | 41,185 | 51,538 | 57,111 | 49,636 | 43,484 | 38,433 | 38,897 |
| 2026 | 39,909 | 32,621 | 33,608 | 34,962 | ||||||||
| - = No Data Reported; -- = Not Applicable; NA = Not Available; W = Withheld to avoid disclosure of individual company data. |
| Release Date: 6/30/2026 |
| Next Release Date: 7/31/2026 |