|
Download Data (XLS File) |
|
||||||||
|
||||||||
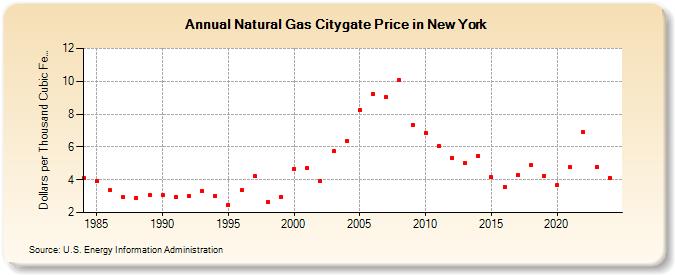
| Natural Gas Citygate Price in New York (Dollars per Thousand Cubic Feet) | ||||||||
| Decade | Year-0 | Year-1 | Year-2 | Year-3 | Year-4 | Year-5 | Year-6 | Year-7 | Year-8 | Year-9 |
|---|---|---|---|---|---|---|---|---|---|---|
| 1980's | 4.10 | 3.94 | 3.35 | 2.92 | 2.91 | 3.07 | ||||
| 1990's | 3.05 | 2.92 | 3.01 | 3.32 | 3.02 | 2.47 | 3.36 | 4.20 | 2.65 | 2.92 |
| 2000's | 4.67 | 4.71 | 3.90 | 5.73 | 6.36 | 8.22 | 9.22 | 9.02 | 10.07 | 7.35 |
| 2010's | 6.86 | 6.04 | 5.35 | 5.02 | 5.47 | 4.15 | 3.57 | 4.29 | 4.87 | 4.25 |
| 2020's | 3.65 | 4.77 | 6.89 | 4.78 | 4.16 | 5.28 |
| - = No Data Reported; -- = Not Applicable; NA = Not Available; W = Withheld to avoid disclosure of individual company data. |
| Release Date: 6/30/2026 |
| Next Release Date: 7/31/2026 |