|
Download Data (XLS File) |
|
||||||||
|
||||||||
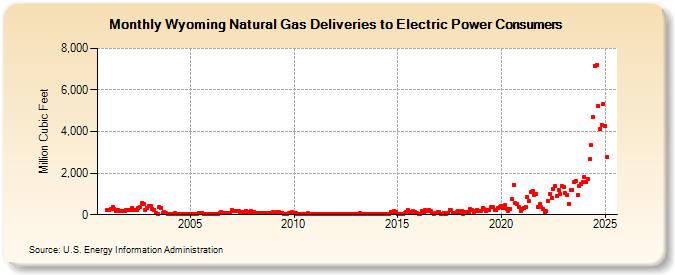
| Wyoming Natural Gas Deliveries to Electric Power Consumers (Million Cubic Feet) | ||||||||
| Year | Jan | Feb | Mar | Apr | May | Jun | Jul | Aug | Sep | Oct | Nov | Dec |
|---|---|---|---|---|---|---|---|---|---|---|---|---|
| 2001 | 229 | 229 | 269 | 384 | 256 | 162 | 228 | 186 | 173 | 196 | 193 | 224 |
| 2002 | 217 | 214 | 340 | 231 | 217 | 230 | 317 | 387 | 576 | 498 | 217 | 320 |
| 2003 | 399 | 439 | 266 | 249 | 90 | 58 | 354 | 314 | 105 | 111 | 60 | 38 |
| 2004 | 46 | 48 | 53 | 63 | 53 | 36 | 41 | 38 | 36 | 36 | 37 | 44 |
| 2005 | 40 | 28 | 40 | 34 | 42 | 60 | 80 | 75 | 54 | 37 | 39 | 48 |
| 2006 | 45 | 42 | 51 | 47 | 57 | 79 | 119 | 101 | 77 | 76 | 61 | 71 |
| 2007 | 214 | 188 | 192 | 178 | 164 | 143 | 128 | 142 | 191 | 146 | 137 | 201 |
| 2008 | 108 | 107 | 95 | 93 | 90 | 71 | 95 | 74 | 75 | 94 | 86 | 100 |
| 2009 | 117 | 96 | 112 | 123 | 102 | 77 | 41 | 56 | 55 | 104 | 89 | 107 |
| 2010 | 92 | 60 | 42 | 30 | 36 | 45 | 31 | 37 | 63 | 49 | 53 | 55 |
| 2011 | 33 | 43 | 38 | 39 | 40 | 28 | 50 | 17 | 23 | 31 | 40 | 36 |
| 2012 | 51 | 51 | 40 | 52 | 36 | 45 | 31 | 36 | 29 | 45 | 30 | 51 |
| 2013 | 50 | 49 | 59 | 54 | 46 | 32 | 41 | 35 | 24 | 43 | 46 | 55 |
| 2014 | 41 | 39 | 36 | 29 | 32 | 30 | 35 | 22 | 148 | 95 | 195 | 128 |
| 2015 | 56 | 23 | 53 | 30 | 68 | 141 | 216 | 154 | 108 | 161 | 150 | 72 |
| 2016 | 32 | 37 | 161 | 135 | 223 | 169 | 205 | 190 | 62 | 45 | 106 | 148 |
| 2017 | 113 | 46 | 22 | 76 | 58 | 92 | 239 | 203 | 104 | 71 | 110 | 174 |
| 2018 | 61 | 170 | 51 | 138 | 141 | 133 | 257 | 213 | 136 | 179 | 224 | 170 |
| 2019 | 162 | 312 | 255 | 167 | 243 | 217 | 388 | 376 | 225 | 229 | 324 | 373 |
| 2020 | 416 | 341 | 446 | 268 | 158 | 284 | 736 | 1,442 | 541 | 518 | 380 | 196 |
| 2021 | 280 | 319 | 369 | 856 | 645 | 1,105 | 1,156 | 946 | 1,002 | 386 | 498 | 358 |
| 2022 | 258 | 115 | 178 | 679 | 986 | 819 | 1,231 | 1,366 | 916 | 1,194 | 973 | 1,377 |
| 2023 | 1,342 | 1,059 | 958 | 406 | 1,135 | 1,089 | 1,474 | 1,537 | 896 | 1,298 | 1,486 | 1,575 |
| 2024 | 1,825 | 1,583 | 1,721 | 2,638 | 3,157 | 4,522 | 7,068 | 7,164 | 5,168 | 4,119 | 4,292 | 5,342 |
| 2025 | 4,241 | 2,796 | 1,873 | 3,047 | 2,493 | 4,143 | 5,549 | 5,836 | 3,174 | 1,587 | 4,253 | 1,902 |
| 2026 | 2,150 | 2,755 | 3,148 | 3,552 | ||||||||
| - = No Data Reported; -- = Not Applicable; NA = Not Available; W = Withheld to avoid disclosure of individual company data. |
| Release Date: 6/30/2026 |
| Next Release Date: 7/31/2026 |