|
Download Data (XLS File) |
|
||||||||
|
||||||||
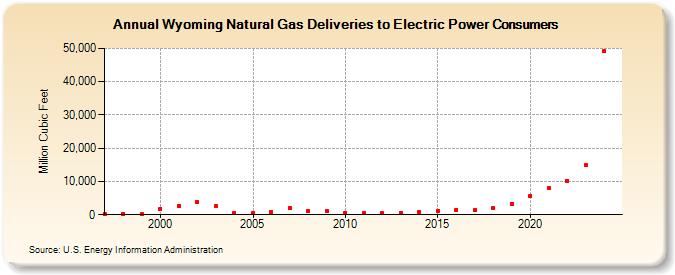
| Wyoming Natural Gas Deliveries to Electric Power Consumers (Million Cubic Feet) | ||||||||
| Decade | Year-0 | Year-1 | Year-2 | Year-3 | Year-4 | Year-5 | Year-6 | Year-7 | Year-8 | Year-9 |
|---|---|---|---|---|---|---|---|---|---|---|
| 1990's | 95 | 271 | 167 | |||||||
| 2000's | 1,843 | 2,727 | 3,764 | 2,484 | 532 | 576 | 827 | 2,024 | 1,088 | 1,079 |
| 2010's | 592 | 418 | 496 | 535 | 831 | 1,233 | 1,514 | 1,307 | 1,873 | 3,271 |
| 2020's | 5,727 | 7,922 | 10,091 | 14,254 | 48,600 | 40,893 |
| - = No Data Reported; -- = Not Applicable; NA = Not Available; W = Withheld to avoid disclosure of individual company data. |
| Release Date: 6/30/2026 |
| Next Release Date: 7/31/2026 |