|
Download Data (XLS File) |
|
||||||||
|
||||||||
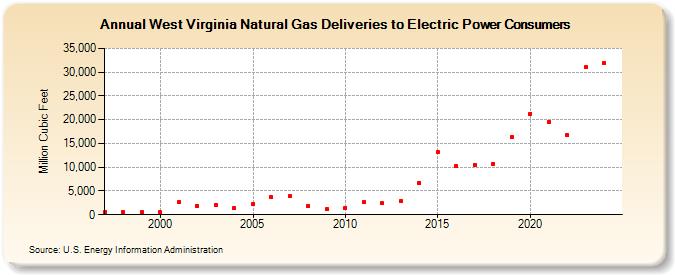
| West Virginia Natural Gas Deliveries to Electric Power Consumers (Million Cubic Feet) | ||||||||
| Decade | Year-0 | Year-1 | Year-2 | Year-3 | Year-4 | Year-5 | Year-6 | Year-7 | Year-8 | Year-9 |
|---|---|---|---|---|---|---|---|---|---|---|
| 1990's | 569 | 515 | 499 | |||||||
| 2000's | 516 | 2,620 | 1,885 | 2,084 | 1,406 | 2,287 | 3,664 | 3,849 | 1,889 | 1,109 |
| 2010's | 1,480 | 2,579 | 2,361 | 2,840 | 6,711 | 13,221 | 10,167 | 10,426 | 10,725 | 16,451 |
| 2020's | 21,277 | 19,543 | 16,769 | 31,433 | 31,242 | 27,574 |
| - = No Data Reported; -- = Not Applicable; NA = Not Available; W = Withheld to avoid disclosure of individual company data. |
| Release Date: 6/30/2026 |
| Next Release Date: 7/31/2026 |