|
Download Data (XLS File) |
|
||||||||
|
||||||||
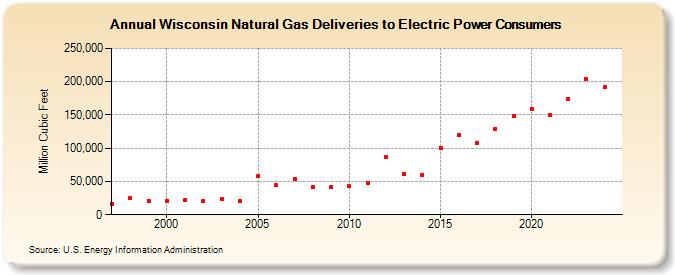
| Wisconsin Natural Gas Deliveries to Electric Power Consumers (Million Cubic Feet) | ||||||||
| Decade | Year-0 | Year-1 | Year-2 | Year-3 | Year-4 | Year-5 | Year-6 | Year-7 | Year-8 | Year-9 |
|---|---|---|---|---|---|---|---|---|---|---|
| 1990's | 15,776 | 24,377 | 21,261 | |||||||
| 2000's | 21,222 | 22,358 | 20,541 | 24,130 | 21,291 | 58,618 | 43,977 | 54,157 | 41,135 | 41,006 |
| 2010's | 42,639 | 47,727 | 86,975 | 61,188 | 60,285 | 100,502 | 119,613 | 107,332 | 129,494 | 148,245 |
| 2020's | 159,513 | 149,669 | 174,053 | 184,043 | 188,769 | 172,495 |
| - = No Data Reported; -- = Not Applicable; NA = Not Available; W = Withheld to avoid disclosure of individual company data. |
| Release Date: 6/30/2026 |
| Next Release Date: 7/31/2026 |