|
Download Data (XLS File) |
|
||||||||
|
||||||||
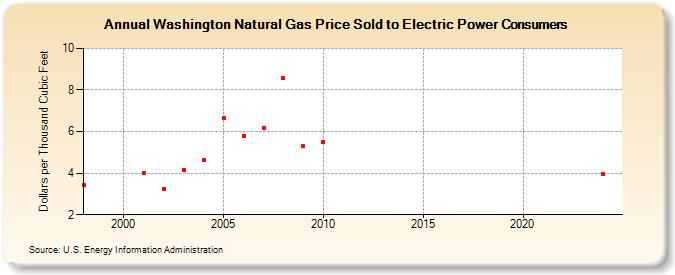
| Washington Natural Gas Price Sold to Electric Power Consumers (Dollars per Thousand Cubic Feet) | ||||||||
| Decade | Year-0 | Year-1 | Year-2 | Year-3 | Year-4 | Year-5 | Year-6 | Year-7 | Year-8 | Year-9 |
|---|---|---|---|---|---|---|---|---|---|---|
| 1990's | 3.44 | |||||||||
| 2000's | 4.03 | 3.25 | 4.17 | 4.63 | 6.64 | 5.81 | 6.15 | 8.56 | 5.29 | |
| 2010's | 5.52 | W | W | W | W | W | W | W | W | W |
| 2020's | W | W | W | W | W | W |
| - = No Data Reported; -- = Not Applicable; NA = Not Available; W = Withheld to avoid disclosure of individual company data. |
| Release Date: 3/31/2026 |
| Next Release Date: 4/30/2026 |