|
Download Data (XLS File) |
|
||||||||
|
||||||||
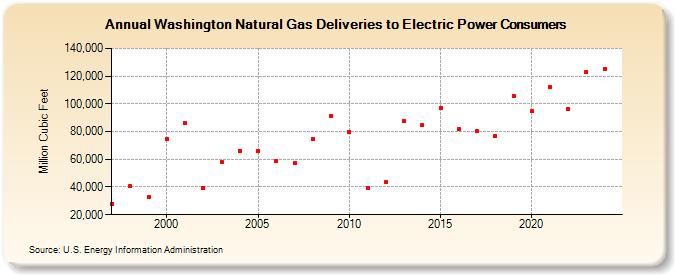
| Washington Natural Gas Deliveries to Electric Power Consumers (Million Cubic Feet) | ||||||||
| Decade | Year-0 | Year-1 | Year-2 | Year-3 | Year-4 | Year-5 | Year-6 | Year-7 | Year-8 | Year-9 |
|---|---|---|---|---|---|---|---|---|---|---|
| 1990's | 27,725 | 40,373 | 32,639 | |||||||
| 2000's | 74,400 | 86,184 | 39,552 | 57,880 | 66,068 | 65,809 | 58,800 | 57,294 | 74,580 | 91,308 |
| 2010's | 79,535 | 39,265 | 43,336 | 87,671 | 84,531 | 96,897 | 81,728 | 80,589 | 76,549 | 105,832 |
| 2020's | 94,574 | 112,204 | 96,557 | 135,189 | 122,986 | 111,962 |
| - = No Data Reported; -- = Not Applicable; NA = Not Available; W = Withheld to avoid disclosure of individual company data. |
| Release Date: 6/30/2026 |
| Next Release Date: 7/31/2026 |