|
Download Data (XLS File) |
|
||||||||
|
||||||||
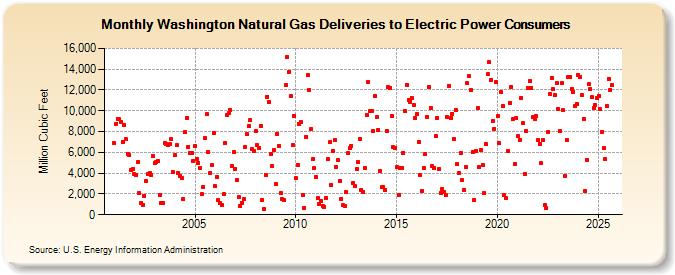
| Washington Natural Gas Deliveries to Electric Power Consumers (Million Cubic Feet) | ||||||||
| Year | Jan | Feb | Mar | Apr | May | Jun | Jul | Aug | Sep | Oct | Nov | Dec |
|---|---|---|---|---|---|---|---|---|---|---|---|---|
| 2001 | 6,896 | 8,729 | 9,248 | 9,179 | 8,961 | 7,013 | 8,652 | 7,236 | 5,871 | 5,763 | 4,277 | 4,358 |
| 2002 | 3,915 | 3,853 | 5,065 | 2,048 | 1,168 | 981 | 1,848 | 3,219 | 3,934 | 4,011 | 3,821 | 5,690 |
| 2003 | 5,000 | 5,051 | 5,173 | 1,890 | 1,140 | 1,121 | 6,914 | 6,789 | 6,675 | 6,771 | 7,268 | 4,089 |
| 2004 | 5,717 | 6,676 | 4,023 | 3,768 | 3,523 | 1,511 | 7,909 | 9,321 | 6,539 | 5,953 | 5,921 | 5,207 |
| 2005 | 6,588 | 5,392 | 5,018 | 4,463 | 1,988 | 2,690 | 7,363 | 9,648 | 5,998 | 4,052 | 4,764 | 7,844 |
| 2006 | 2,717 | 3,652 | 1,403 | 1,089 | 970 | 1,956 | 6,853 | 9,570 | 9,799 | 10,060 | 4,698 | 6,032 |
| 2007 | 4,414 | 3,318 | 1,723 | 818 | 1,160 | 1,504 | 6,547 | 7,760 | 8,507 | 9,084 | 6,289 | 6,170 |
| 2008 | 8,062 | 6,681 | 6,463 | 8,527 | 1,457 | 572 | 3,859 | 11,352 | 10,866 | 5,874 | 4,655 | 6,212 |
| 2009 | 2,925 | 7,771 | 6,614 | 2,077 | 1,509 | 1,403 | 12,467 | 15,186 | 13,747 | 11,396 | 6,686 | 9,528 |
| 2010 | 3,529 | 4,793 | 8,693 | 8,889 | 1,919 | 661 | 7,516 | 13,427 | 12,041 | 8,267 | 5,325 | 4,475 |
| 2011 | 3,649 | 1,591 | 1,066 | 1,297 | 856 | 776 | 1,628 | 5,312 | 6,961 | 2,812 | 6,117 | 7,201 |
| 2012 | 4,566 | 5,246 | 3,270 | 1,547 | 896 | 840 | 2,169 | 5,935 | 6,370 | 6,656 | 3,081 | 2,760 |
| 2013 | 4,392 | 5,029 | 7,274 | 2,398 | 2,188 | 4,500 | 9,611 | 12,810 | 9,961 | 10,017 | 8,058 | 11,432 |
| 2014 | 9,398 | 8,191 | 4,229 | 2,674 | 2,623 | 2,381 | 8,091 | 12,308 | 12,192 | 9,509 | 6,483 | 6,452 |
| 2015 | 4,618 | 1,860 | 4,517 | 4,488 | 5,976 | 9,992 | 12,516 | 10,989 | 10,873 | 11,212 | 10,567 | 9,289 |
| 2016 | 9,645 | 7,033 | 3,785 | 2,305 | 4,514 | 5,834 | 9,406 | 12,263 | 10,306 | 4,641 | 4,450 | 7,547 |
| 2017 | 9,329 | 4,418 | 2,124 | 2,433 | 2,221 | 1,878 | 9,373 | 12,412 | 9,295 | 9,721 | 7,292 | 10,093 |
| 2018 | 4,845 | 3,998 | 5,907 | 3,294 | 2,378 | 4,572 | 12,641 | 13,307 | 12,021 | 6,018 | 1,433 | 6,135 |
| 2019 | 10,228 | 4,584 | 6,217 | 4,759 | 2,073 | 6,770 | 13,495 | 14,645 | 12,999 | 9,014 | 8,274 | 12,776 |
| 2020 | 9,480 | 6,865 | 11,763 | 10,487 | 1,866 | 1,604 | 6,095 | 10,777 | 12,301 | 9,172 | 4,885 | 9,279 |
| 2021 | 7,570 | 7,213 | 11,229 | 8,784 | 3,934 | 8,095 | 12,201 | 12,861 | 12,234 | 9,430 | 9,189 | 9,464 |
| 2022 | 7,187 | 6,759 | 4,942 | 7,185 | 915 | 598 | 7,999 | 11,577 | 13,188 | 12,056 | 11,484 | 12,665 |
| 2023 | 12,278 | 9,679 | 14,702 | 10,918 | 1,938 | 6,167 | 12,988 | 14,002 | 13,712 | 13,559 | 12,657 | 12,589 |
| 2024 | 13,441 | 13,229 | 11,490 | 9,221 | 2,271 | 5,299 | 12,540 | 12,112 | 11,289 | 10,284 | 10,560 | 11,250 |
| 2025 | 11,437 | 10,135 | 7,988 | 6,404 | 5,326 | 10,436 | 13,093 | 12,014 | 12,466 | 9,672 | 6,251 | 6,740 |
| 2026 | 5,815 | 5,145 | 4,218 | 2,791 | ||||||||
| - = No Data Reported; -- = Not Applicable; NA = Not Available; W = Withheld to avoid disclosure of individual company data. |
| Release Date: 6/30/2026 |
| Next Release Date: 7/31/2026 |