|
Download Data (XLS File) |
|
||||||||
|
||||||||
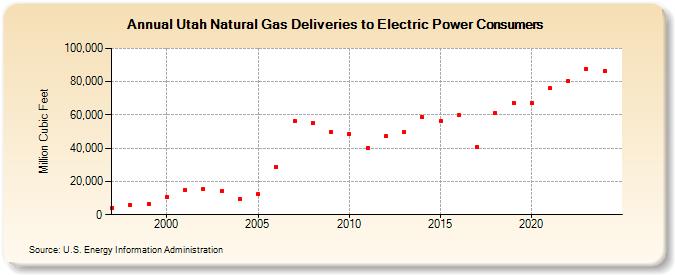
| Utah Natural Gas Deliveries to Electric Power Consumers (Million Cubic Feet) | ||||||||
| Decade | Year-0 | Year-1 | Year-2 | Year-3 | Year-4 | Year-5 | Year-6 | Year-7 | Year-8 | Year-9 |
|---|---|---|---|---|---|---|---|---|---|---|
| 1990's | 4,079 | 5,945 | 6,478 | |||||||
| 2000's | 10,544 | 15,141 | 15,439 | 14,484 | 9,423 | 12,239 | 28,953 | 56,438 | 55,374 | 49,984 |
| 2010's | 48,399 | 40,138 | 47,138 | 49,562 | 58,780 | 56,449 | 59,684 | 40,830 | 61,161 | 67,386 |
| 2020's | 67,226 | 75,956 | 80,353 | 87,231 | 87,117 | 83,375 |
| - = No Data Reported; -- = Not Applicable; NA = Not Available; W = Withheld to avoid disclosure of individual company data. |
| Release Date: 6/30/2026 |
| Next Release Date: 7/31/2026 |