|
Download Data (XLS File) |
|
||||||||
|
||||||||
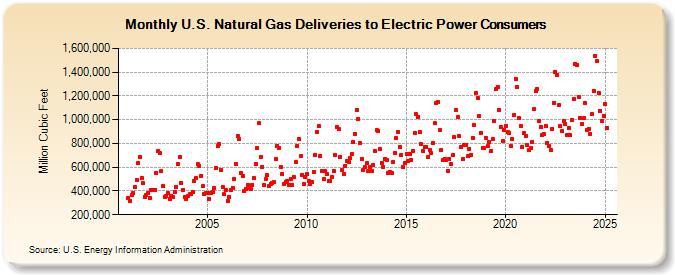
| U.S. Natural Gas Deliveries to Electric Power Consumers (Million Cubic Feet) | ||||||||
| Year | Jan | Feb | Mar | Apr | May | Jun | Jul | Aug | Sep | Oct | Nov | Dec |
|---|---|---|---|---|---|---|---|---|---|---|---|---|
| 2001 | 340,292 | 312,843 | 362,843 | 384,494 | 433,923 | 492,819 | 634,425 | 686,753 | 510,262 | 466,080 | 350,549 | 367,018 |
| 2002 | 381,434 | 344,243 | 406,516 | 404,384 | 410,108 | 550,941 | 733,887 | 717,592 | 568,699 | 442,357 | 351,612 | 360,123 |
| 2003 | 382,443 | 334,698 | 361,243 | 352,164 | 394,021 | 435,598 | 630,270 | 683,513 | 468,510 | 408,817 | 348,129 | 335,810 |
| 2004 | 361,401 | 373,466 | 375,203 | 389,328 | 485,114 | 508,140 | 626,401 | 612,571 | 529,440 | 439,841 | 376,169 | 386,690 |
| 2005 | 384,710 | 330,547 | 386,309 | 390,358 | 422,978 | 594,137 | 777,000 | 791,293 | 577,543 | 434,692 | 373,351 | 406,226 |
| 2006 | 318,364 | 346,138 | 406,970 | 426,027 | 504,409 | 629,660 | 863,531 | 840,197 | 548,321 | 527,532 | 396,586 | 414,365 |
| 2007 | 448,149 | 425,485 | 416,015 | 453,144 | 507,089 | 628,467 | 760,521 | 969,433 | 683,327 | 604,092 | 448,180 | 497,505 |
| 2008 | 531,460 | 438,868 | 460,763 | 469,607 | 475,467 | 665,436 | 782,039 | 762,946 | 602,565 | 545,244 | 457,591 | 476,394 |
| 2009 | 487,426 | 453,472 | 499,678 | 451,395 | 515,476 | 642,797 | 778,017 | 840,317 | 690,011 | 537,013 | 457,085 | 519,846 |
| 2010 | 545,811 | 479,615 | 456,864 | 471,481 | 559,665 | 705,665 | 897,182 | 943,002 | 696,723 | 570,363 | 496,539 | 564,274 |
| 2011 | 539,792 | 483,686 | 481,926 | 521,453 | 571,998 | 699,414 | 938,575 | 921,449 | 684,198 | 574,932 | 542,546 | 613,894 |
| 2012 | 648,823 | 644,530 | 674,099 | 714,338 | 812,467 | 879,881 | 1,081,688 | 1,003,938 | 802,588 | 669,195 | 579,745 | 599,502 |
| 2013 | 631,685 | 568,388 | 603,910 | 564,827 | 614,808 | 737,150 | 911,124 | 900,530 | 751,482 | 637,038 | 601,019 | 668,792 |
| 2014 | 662,881 | 551,109 | 560,808 | 548,899 | 646,929 | 720,750 | 843,303 | 897,806 | 770,947 | 703,390 | 600,392 | 638,769 |
| 2015 | 711,324 | 648,343 | 708,731 | 664,276 | 734,486 | 886,475 | 1,045,542 | 1,026,590 | 895,044 | 791,541 | 732,413 | 768,606 |
| 2016 | 773,954 | 689,800 | 744,765 | 718,893 | 804,431 | 970,308 | 1,139,968 | 1,151,236 | 915,286 | 743,796 | 662,046 | 670,787 |
| 2017 | 659,623 | 568,781 | 672,176 | 627,049 | 700,059 | 851,035 | 1,081,826 | 1,022,019 | 859,260 | 772,543 | 666,156 | 785,029 |
| 2018 | 786,001 | 690,022 | 756,528 | 703,919 | 848,085 | 952,554 | 1,223,514 | 1,185,530 | 1,029,799 | 887,814 | 762,951 | 762,221 |
| 2019 | 848,519 | 779,310 | 813,526 | 739,680 | 836,087 | 990,562 | 1,254,667 | 1,277,904 | 1,080,775 | 936,668 | 818,868 | 911,529 |
| 2020 | 948,931 | 893,044 | 890,784 | 777,804 | 837,108 | 1,041,101 | 1,345,797 | 1,276,048 | 1,015,907 | 948,293 | 772,059 | 884,847 |
| 2021 | 864,025 | 784,546 | 741,980 | 761,281 | 813,818 | 1,087,086 | 1,238,444 | 1,262,329 | 988,732 | 939,059 | 868,341 | 878,946 |
| 2022 | 949,215 | 803,999 | 776,847 | 743,075 | 922,687 | 1,144,526 | 1,404,970 | 1,380,145 | 1,125,139 | 946,433 | 902,107 | 992,402 |
| 2023 | 963,753 | 866,638 | 936,800 | 862,867 | 989,438 | 1,177,630 | 1,474,741 | 1,471,536 | 1,198,735 | 1,015,953 | 963,182 | 1,019,614 |
| 2024 | 1,136,992 | 912,713 | 919,206 | 879,880 | 1,047,676 | 1,238,441 | 1,527,648 | 1,496,491 | 1,222,596 | 1,070,511 | 987,483 | 1,036,809 |
| 2025 | 1,124,945 | 931,879 | 830,485 | 830,132 | 972,309 | 1,211,356 | 1,493,789 | 1,409,494 | 1,221,271 | 1,035,432 | 946,039 | 1,047,134 |
| 2026 | 1,093,057 | 946,656 | 917,974 | 897,774 | ||||||||
| - = No Data Reported; -- = Not Applicable; NA = Not Available; W = Withheld to avoid disclosure of individual company data. |
| Release Date: 6/30/2026 |
| Next Release Date: 7/31/2026 |