|
Download Data (XLS File) |
|
||||||||
|
||||||||
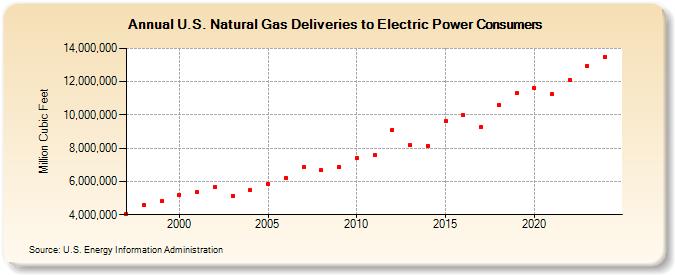
| U.S. Natural Gas Deliveries to Electric Power Consumers (Million Cubic Feet) | ||||||||
| Decade | Year-0 | Year-1 | Year-2 | Year-3 | Year-4 | Year-5 | Year-6 | Year-7 | Year-8 | Year-9 |
|---|---|---|---|---|---|---|---|---|---|---|
| 1990's | 4,064,803 | 4,588,284 | 4,819,531 | |||||||
| 2000's | 5,206,324 | 5,342,301 | 5,671,897 | 5,135,215 | 5,463,763 | 5,869,145 | 6,222,100 | 6,841,408 | 6,668,379 | 6,872,533 |
| 2010's | 7,387,184 | 7,573,863 | 9,110,793 | 8,190,756 | 8,145,982 | 9,613,370 | 9,985,270 | 9,265,555 | 10,588,937 | 11,288,096 |
| 2020's | 11,631,723 | 11,228,587 | 12,091,546 | 12,940,889 | 13,476,447 | 13,054,265 |
| - = No Data Reported; -- = Not Applicable; NA = Not Available; W = Withheld to avoid disclosure of individual company data. |
| Release Date: 6/30/2026 |
| Next Release Date: 7/31/2026 |