|
Download Data (XLS File) |
|
||||||||
|
||||||||
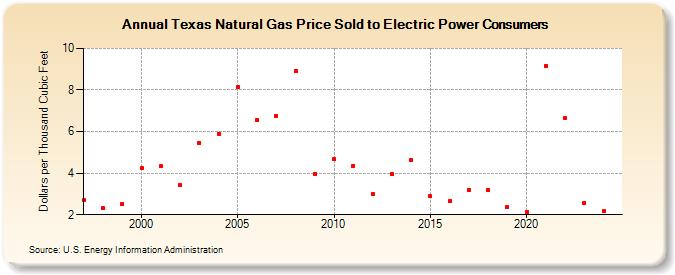
| Texas Natural Gas Price Sold to Electric Power Consumers (Dollars per Thousand Cubic Feet) | ||||||||
| Decade | Year-0 | Year-1 | Year-2 | Year-3 | Year-4 | Year-5 | Year-6 | Year-7 | Year-8 | Year-9 |
|---|---|---|---|---|---|---|---|---|---|---|
| 1990's | 2.69 | 2.30 | 2.51 | |||||||
| 2000's | 4.24 | 4.32 | 3.41 | 5.47 | 5.90 | 8.12 | 6.55 | 6.77 | 8.91 | 3.96 |
| 2010's | 4.66 | 4.36 | 2.99 | 3.94 | 4.62 | 2.88 | 2.67 | 3.18 | 3.17 | 2.39 |
| 2020's | 2.14 | 9.17 | 6.63 | 2.65 | 2.17 | 3.14 |
| - = No Data Reported; -- = Not Applicable; NA = Not Available; W = Withheld to avoid disclosure of individual company data. |
| Release Date: 6/30/2026 |
| Next Release Date: 7/31/2026 |