|
Download Data (XLS File) |
|
||||||||
|
||||||||
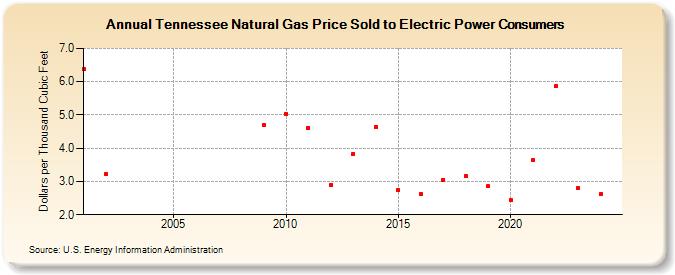
| Tennessee Natural Gas Price Sold to Electric Power Consumers (Dollars per Thousand Cubic Feet) | ||||||||
| Decade | Year-0 | Year-1 | Year-2 | Year-3 | Year-4 | Year-5 | Year-6 | Year-7 | Year-8 | Year-9 |
|---|---|---|---|---|---|---|---|---|---|---|
| 2000's | 6.38 | 3.22 | W | W | W | W | W | W | 4.70 | |
| 2010's | 5.04 | 4.62 | 2.90 | 3.83 | 4.64 | 2.74 | 2.61 | 3.05 | 3.17 | 2.85 |
| 2020's | 2.44 | 3.64 | 5.86 | 2.83 | 2.64 | 3.87 |
| - = No Data Reported; -- = Not Applicable; NA = Not Available; W = Withheld to avoid disclosure of individual company data. |
| Release Date: 3/31/2026 |
| Next Release Date: 4/30/2026 |