|
Download Data (XLS File) |
|
||||||||
|
||||||||
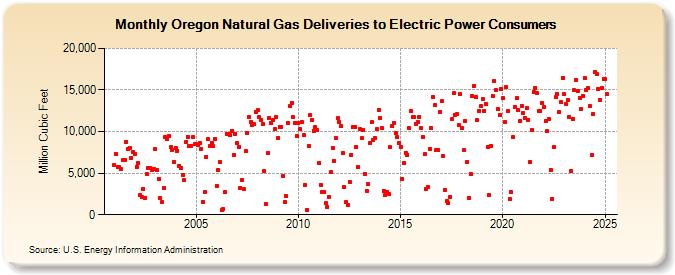
| Oregon Natural Gas Deliveries to Electric Power Consumers (Million Cubic Feet) | ||||||||
| Year | Jan | Feb | Mar | Apr | May | Jun | Jul | Aug | Sep | Oct | Nov | Dec |
|---|---|---|---|---|---|---|---|---|---|---|---|---|
| 2001 | 5,971 | 7,343 | 5,742 | 5,695 | 5,456 | 6,550 | 6,621 | 8,791 | 7,952 | 8,062 | 6,832 | 7,527 |
| 2002 | 7,332 | 5,748 | 6,225 | 2,355 | 2,073 | 3,093 | 2,066 | 4,899 | 5,614 | 5,579 | 5,330 | 5,541 |
| 2003 | 7,862 | 5,409 | 4,352 | 1,994 | 1,537 | 3,203 | 9,285 | 9,064 | 9,436 | 8,083 | 7,783 | 6,392 |
| 2004 | 8,070 | 7,672 | 5,888 | 5,633 | 4,756 | 4,199 | 8,724 | 9,401 | 8,320 | 8,314 | 9,292 | 8,464 |
| 2005 | 8,480 | 8,335 | 8,641 | 7,944 | 1,561 | 2,690 | 6,970 | 9,097 | 8,251 | 8,661 | 8,210 | 9,159 |
| 2006 | 3,510 | 5,417 | 6,304 | 588 | 711 | 2,700 | 9,740 | 9,646 | 9,542 | 10,105 | 7,221 | 9,701 |
| 2007 | 8,621 | 8,162 | 3,229 | 4,181 | 3,044 | 7,634 | 9,811 | 11,709 | 11,136 | 10,764 | 10,857 | 12,357 |
| 2008 | 12,547 | 11,694 | 11,408 | 10,898 | 5,223 | 1,311 | 7,423 | 11,630 | 11,046 | 11,390 | 10,298 | 11,769 |
| 2009 | 9,263 | 10,599 | 10,584 | 4,698 | 1,536 | 2,235 | 11,065 | 13,027 | 13,473 | 11,712 | 11,012 | 9,503 |
| 2010 | 11,061 | 10,336 | 11,107 | 9,553 | 3,601 | 621 | 8,245 | 12,010 | 11,428 | 10,111 | 10,535 | 10,219 |
| 2011 | 6,264 | 3,628 | 2,711 | 2,712 | 1,368 | 936 | 2,148 | 5,120 | 8,021 | 6,517 | 9,240 | 11,590 |
| 2012 | 11,175 | 10,620 | 7,402 | 3,321 | 1,492 | 1,156 | 3,981 | 7,219 | 10,546 | 10,565 | 8,185 | 5,782 |
| 2013 | 10,257 | 9,182 | 10,233 | 4,955 | 2,888 | 3,658 | 8,602 | 11,092 | 9,035 | 9,176 | 10,279 | 12,574 |
| 2014 | 11,675 | 10,414 | 2,874 | 2,313 | 2,766 | 2,521 | 8,115 | 10,633 | 11,064 | 9,801 | 9,306 | 8,616 |
| 2015 | 8,153 | 4,342 | 6,250 | 7,467 | 7,174 | 10,384 | 12,432 | 11,706 | 11,743 | 10,949 | 11,133 | 11,787 |
| 2016 | 10,372 | 9,347 | 7,267 | 3,049 | 3,311 | 7,931 | 10,409 | 14,200 | 13,161 | 7,778 | 7,806 | 12,372 |
| 2017 | 13,640 | 7,117 | 2,970 | 1,666 | 1,436 | 2,162 | 11,462 | 14,579 | 11,970 | 12,075 | 10,802 | 14,483 |
| 2018 | 10,389 | 7,733 | 11,243 | 6,282 | 2,024 | 4,921 | 14,300 | 15,492 | 14,148 | 11,349 | 12,460 | 13,025 |
| 2019 | 13,906 | 12,480 | 13,344 | 8,150 | 2,337 | 8,277 | 14,326 | 16,107 | 14,937 | 12,708 | 12,046 | 15,175 |
| 2020 | 13,995 | 11,135 | 15,375 | 12,426 | 1,887 | 2,678 | 9,292 | 12,996 | 13,976 | 12,544 | 11,284 | 13,082 |
| 2021 | 12,194 | 11,575 | 12,827 | 11,440 | 6,376 | 10,229 | 14,780 | 15,294 | 14,600 | 12,530 | 12,524 | 13,446 |
| 2022 | 12,918 | 11,305 | 10,010 | 11,545 | 5,410 | 1,933 | 8,167 | 14,106 | 14,519 | 12,410 | 13,502 | 16,433 |
| 2023 | 15,448 | 14,445 | 14,963 | 10,529 | 3,350 | 11,059 | 15,084 | 16,636 | 16,415 | 15,921 | 13,429 | 16,118 |
| 2024 | 17,628 | 15,339 | 14,763 | 12,705 | 5,745 | 11,682 | 16,414 | 16,828 | 16,596 | 14,912 | 15,413 | 16,422 |
| 2025 | 16,472 | 14,573 | 10,423 | 7,574 | 7,901 | 11,492 | 16,483 | 16,664 | 15,786 | 12,134 | 14,661 | 14,133 |
| 2026 | 15,187 | 14,206 | 9,297 | 9,864 | ||||||||
| - = No Data Reported; -- = Not Applicable; NA = Not Available; W = Withheld to avoid disclosure of individual company data. |
| Release Date: 6/30/2026 |
| Next Release Date: 7/31/2026 |