|
Download Data (XLS File) |
|
||||||||
|
||||||||
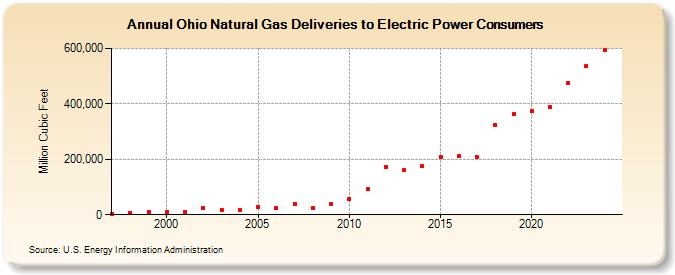
| Ohio Natural Gas Deliveries to Electric Power Consumers (Million Cubic Feet) | ||||||||
| Decade | Year-0 | Year-1 | Year-2 | Year-3 | Year-4 | Year-5 | Year-6 | Year-7 | Year-8 | Year-9 |
|---|---|---|---|---|---|---|---|---|---|---|
| 1990's | 3,491 | 7,981 | 11,388 | |||||||
| 2000's | 10,123 | 10,545 | 22,722 | 18,774 | 18,258 | 27,941 | 23,184 | 37,292 | 23,493 | 37,668 |
| 2010's | 58,161 | 92,845 | 171,590 | 161,174 | 175,221 | 208,222 | 212,528 | 207,462 | 322,926 | 363,963 |
| 2020's | 372,998 | 388,742 | 476,805 | 546,393 | 594,647 | 564,572 |
| - = No Data Reported; -- = Not Applicable; NA = Not Available; W = Withheld to avoid disclosure of individual company data. |
| Release Date: 6/30/2026 |
| Next Release Date: 7/31/2026 |