|
Download Data (XLS File) |
|
||||||||
|
||||||||
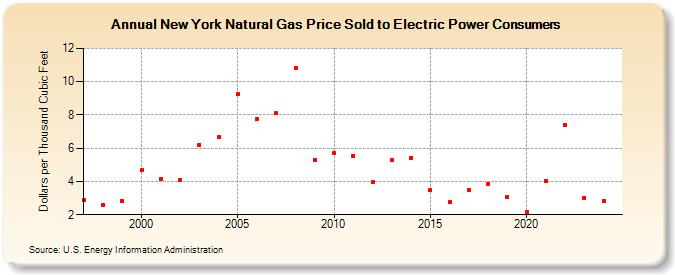
| New York Natural Gas Price Sold to Electric Power Consumers (Dollars per Thousand Cubic Feet) | ||||||||
| Decade | Year-0 | Year-1 | Year-2 | Year-3 | Year-4 | Year-5 | Year-6 | Year-7 | Year-8 | Year-9 |
|---|---|---|---|---|---|---|---|---|---|---|
| 1990's | 2.88 | 2.57 | 2.85 | |||||||
| 2000's | 4.68 | 4.12 | 4.06 | 6.22 | 6.65 | 9.24 | 7.75 | 8.09 | 10.85 | 5.26 |
| 2010's | 5.73 | 5.56 | 3.95 | 5.26 | 5.42 | 3.51 | 2.76 | 3.46 | 3.87 | 3.05 |
| 2020's | 2.19 | 4.05 | 7.41 | 3.02 | 2.79 | 4.52 |
| - = No Data Reported; -- = Not Applicable; NA = Not Available; W = Withheld to avoid disclosure of individual company data. |
| Release Date: 3/31/2026 |
| Next Release Date: 4/30/2026 |