|
Download Data (XLS File) |
|
||||||||
|
||||||||
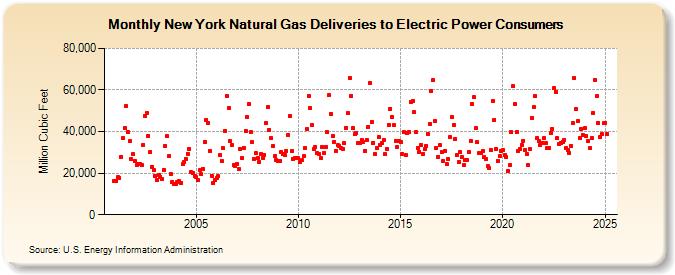
| New York Natural Gas Deliveries to Electric Power Consumers (Million Cubic Feet) | ||||||||
| Year | Jan | Feb | Mar | Apr | May | Jun | Jul | Aug | Sep | Oct | Nov | Dec |
|---|---|---|---|---|---|---|---|---|---|---|---|---|
| 2001 | 16,162 | 16,176 | 17,930 | 17,686 | 27,910 | 36,706 | 41,800 | 52,220 | 39,717 | 35,309 | 26,679 | 29,115 |
| 2002 | 26,059 | 23,831 | 24,629 | 24,408 | 23,869 | 33,762 | 47,533 | 48,900 | 37,923 | 30,298 | 23,132 | 21,361 |
| 2003 | 18,688 | 16,711 | 19,294 | 18,315 | 17,100 | 21,724 | 33,099 | 37,688 | 28,053 | 19,738 | 15,746 | 14,577 |
| 2004 | 14,733 | 15,958 | 16,095 | 15,431 | 24,268 | 25,128 | 26,901 | 29,436 | 31,803 | 20,491 | 20,010 | 18,395 |
| 2005 | 18,089 | 16,484 | 21,312 | 19,399 | 22,143 | 35,084 | 45,765 | 44,111 | 30,741 | 18,807 | 15,476 | 16,648 |
| 2006 | 17,720 | 18,504 | 28,892 | 25,894 | 31,902 | 40,392 | 57,219 | 51,234 | 35,235 | 33,766 | 23,831 | 23,450 |
| 2007 | 24,166 | 21,800 | 31,645 | 27,406 | 32,276 | 40,258 | 46,857 | 53,252 | 39,549 | 34,763 | 26,803 | 29,485 |
| 2008 | 27,409 | 25,293 | 29,131 | 27,391 | 28,709 | 44,133 | 51,834 | 40,875 | 36,839 | 33,147 | 28,179 | 26,446 |
| 2009 | 25,678 | 25,850 | 30,183 | 29,187 | 28,571 | 30,721 | 38,456 | 47,597 | 30,599 | 26,759 | 27,336 | 27,415 |
| 2010 | 27,311 | 25,493 | 26,200 | 28,073 | 31,856 | 41,211 | 57,123 | 51,302 | 43,251 | 31,458 | 32,672 | 29,538 |
| 2011 | 29,397 | 27,122 | 32,716 | 29,690 | 32,463 | 39,657 | 57,410 | 48,539 | 37,955 | 35,001 | 30,698 | 33,370 |
| 2012 | 33,216 | 31,880 | 31,742 | 34,351 | 41,947 | 48,943 | 65,796 | 57,285 | 41,513 | 38,655 | 39,241 | 34,505 |
| 2013 | 34,417 | 35,839 | 35,118 | 30,861 | 36,121 | 42,340 | 63,375 | 44,786 | 34,729 | 29,088 | 31,999 | 37,174 |
| 2014 | 33,604 | 34,274 | 36,044 | 29,045 | 31,762 | 43,321 | 51,020 | 46,926 | 42,923 | 35,619 | 32,781 | 35,477 |
| 2015 | 35,055 | 29,201 | 39,614 | 28,508 | 39,074 | 39,800 | 54,257 | 54,490 | 49,295 | 39,583 | 32,318 | 30,391 |
| 2016 | 33,634 | 29,327 | 31,526 | 33,122 | 39,014 | 43,633 | 59,387 | 64,632 | 44,875 | 32,031 | 27,930 | 33,317 |
| 2017 | 30,182 | 25,846 | 30,828 | 24,266 | 26,888 | 37,181 | 46,794 | 43,154 | 36,218 | 28,819 | 25,286 | 30,028 |
| 2018 | 27,781 | 23,914 | 26,336 | 26,174 | 30,309 | 35,538 | 53,471 | 56,497 | 41,507 | 34,837 | 29,531 | 29,602 |
| 2019 | 30,637 | 27,605 | 26,744 | 23,264 | 22,551 | 30,967 | 54,647 | 45,729 | 31,647 | 25,922 | 28,034 | 30,821 |
| 2020 | 31,081 | 28,623 | 27,838 | 21,071 | 23,837 | 39,889 | 61,731 | 53,369 | 39,594 | 30,882 | 31,693 | 33,770 |
| 2021 | 35,627 | 31,155 | 29,200 | 23,769 | 31,393 | 46,714 | 51,676 | 57,023 | 36,757 | 35,604 | 33,723 | 34,704 |
| 2022 | 36,752 | 34,346 | 31,901 | 32,139 | 39,239 | 41,306 | 60,783 | 59,049 | 36,664 | 33,946 | 34,508 | 34,855 |
| 2023 | 35,544 | 31,556 | 30,920 | 28,310 | 31,340 | 42,130 | 65,398 | 49,691 | 45,353 | 35,194 | 39,428 | 37,189 |
| 2024 | 40,769 | 36,471 | 34,249 | 30,947 | 36,489 | 48,733 | 64,529 | 55,412 | 42,850 | 36,719 | 37,221 | 45,257 |
| 2025 | 42,273 | 37,875 | 32,698 | 31,044 | 32,877 | 47,524 | 68,454 | 53,309 | 40,550 | 36,407 | 38,697 | 45,792 |
| 2026 | 42,521 | 41,477 | 39,282 | 38,008 | ||||||||
| - = No Data Reported; -- = Not Applicable; NA = Not Available; W = Withheld to avoid disclosure of individual company data. |
| Release Date: 6/30/2026 |
| Next Release Date: 7/31/2026 |